
Figures & data
Figure 1. Chemical structure of physcion.
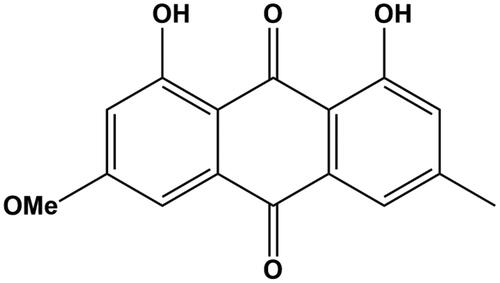
Table 1. Reaction conditions of CYP450 isoforms tested, including maker reactions, incubation conditions and Km used in the inhibition study.
Figure 2. Effect of physcion on the major CYP450 isoforms (A) and its concentration-dependent manner in the inhibition of CYP2C9 (B), 2D6 (C) and 3A4 (D). ****p < 0.0001 relative to the negative control. Negative control: blank treatment; physcion: treated with 100 μM physcion; positive control: treated with typical inhibitors (inhibitor types and concentrations are listed in ).
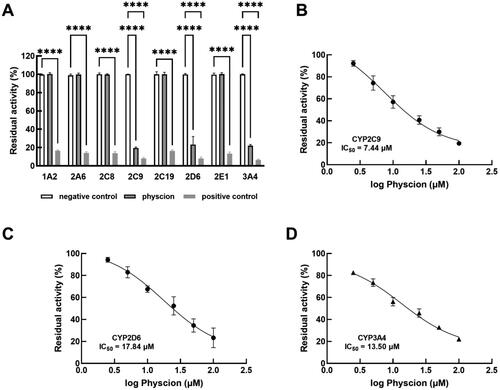
Figure 3. The inhibition of CYP2C9 (A) and 2D6 (B) by physcion was best fitted with the competitive inhibition model by Lineweaver–Burk plot in the presence of 0, 2, 5, 10 and 15 μM physcion and the Ki values were 3.69 and 8.66 μM, respectively.
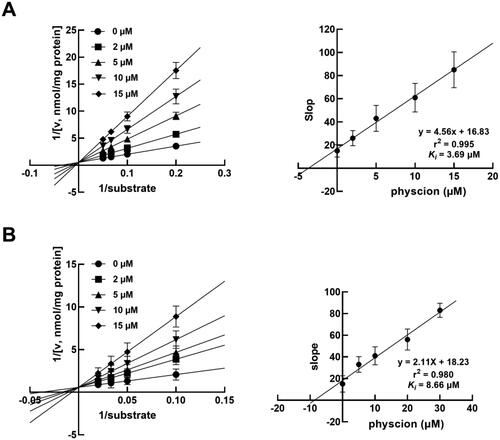
Figure 4. The inhibition of CYP3A4 by physcion was best fitted the non-competitive inhibition model by Lineweaver Burk plot in the presence of 0, 5, 10, 20 and 30 μM physcion (A) and the Ki value was 6.70 μM (B).
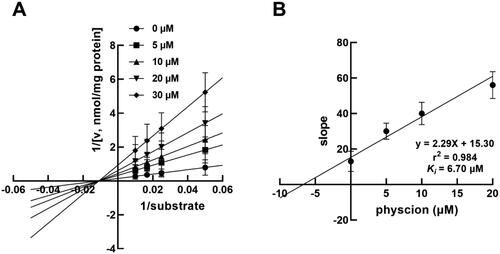
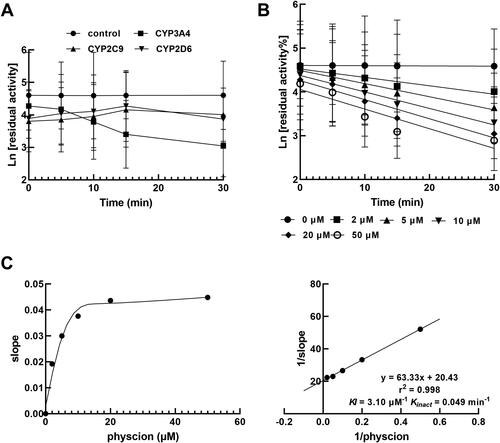
Figure 5. Only the inhibition of CYP3A4 showed a significant time-dependent manner (A), which was observed under various concentrations of physcion (B). The time-dependent KI and Kinact parameters of CYP3A4 were obtained as 3.10 μM−1 and 0.049 min−1, respectively (C).
Data availability statement
The datasets used and/or analysed during this study are available from the corresponding author on reasonable request.