
Figures & data
Figure 1. Babaodan (BBD) antagonized cisplatin resistance in cholangiocarcinoma cells (CCAs) by advancing the inhibition ratio, apoptosis, and inhibiting glutathione (GSH) synthesis. (a) The inhibition ratio curve and the IC50 of cisplatin in CCAs were measured using the cell counting kit 8 (n = 5). (b) according to the inhibition of cisplatin and cisplatin with BBD, 1 mg/mL of BBD was chosen for the follow-up study (n = 5). (c) the inhibition ratio curve and the IC50 of cisplatin with 1 mg/mL BBD in CCAs were also measured using the cell counting kit 8 (n = 5), and the IC50 was significantly reduced compared to cisplatin treatment alone. (d) The apoptosis of CCAs was detected by flow cytometry (n = 3). BBD increased apoptosis levels in a dose-dependent manner. (e) TTGSH, (f) relative activity of GLS, (g) GSH, and (h) GSH/GSSG levels in CCAs with cisplatin treatment were inhibited by BBD treatment in a dose-dependent manner. (mean ± standard deviation) *p < 0.05, **p < 0.01, vs. control group; #p < 0.05, ##p < 0.01, vs. CDDP group.
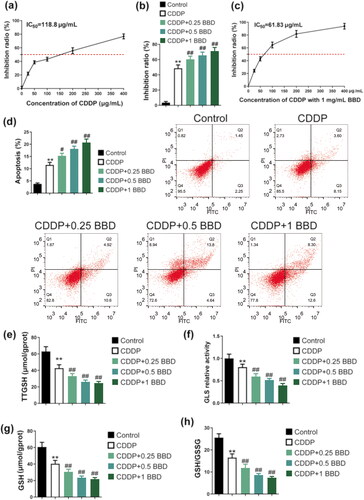
Figure 2. Babaodan (BBD) promoted the effect of cisplatin on DNA damage in cholangiocarcinoma cells (CCAs). (a) characteristic photos showed the DNA damage (×400, scale bar = 50 μm). The comet assay measured (b) the tail moment and (c) the percentage of tail DNA. The combination of cisplatin and BBD increased them compared to cisplatin alone (n = 3). (mean ± standard deviation) *p < 0.05, **p < 0.01, vs. control group; #p < 0.05, ##p < 0.01, vs. CDDP group.
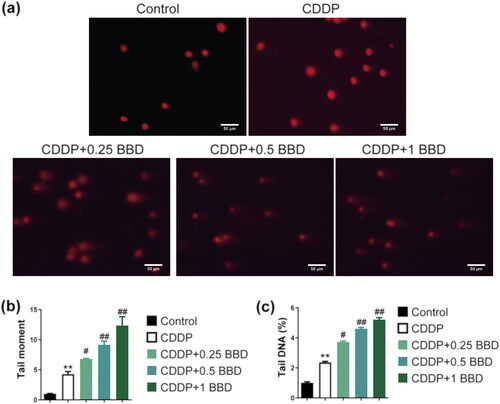
Figure 3. Apoptosis, glutathione (GSH) synthesis, and DNA damage-related protein expression in cholangiocarcinoma cells (CCAs) with co-treatment of babaodan (BBD) and cisplatin. Western blot was used to measure protein levels (n = 3). BBD decreased (a) the bcl-2 level and (b) increased the bax level in a dose-dependent manner. Change in (c) cle-caspase-3/caspase-3 levels with BBD treatment was not statistically significant. In CCAs involving cisplatin, the expression levels of (d) p-YAP1 relative to total YAP1, (e) SLC1A5, and (f) ATF4, which are involved in GSH synthesis, were observed to decrease in a dose-dependent manner following BBD treatment. (g) the γH2Ax level was increased by 1 mg/mL of BBD treatment, and (h) the ERCC1 level was inhibited by treatment with 0.5 and 1 mg/mL of BBD treatment. Representative protein bands are shown in the (i), (j), and (k). (mean ± Standard deviation) *p < 0.05, **p < 0.01, vs. control group; #p < 0.05, ##p < 0.01, vs. CDDP group.
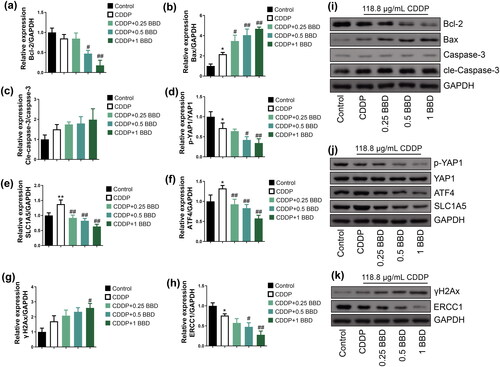
Figure 4. Babaodan (BBD) antagonized cisplatin resistance in cholangiocarcinoma cells (CCAs) by inhibiting YAP1. (a, b) The YAP1 mRNA of CCAs with siYAP1 and YAP1 cDNA transfection was measured using quantitative real-time PCR (n = 3). ##p < 0.01 vs. siNC group; ▲▲p < 0.01 vs. NC group. (c) The inhibition ratio was detected using the cell counting kit 8 (n = 5). (d) apoptosis was measured by flow cytometry (n = 3) and increased in CCAs with YAP1 knockdown. Additionally, YAP1 overexpression antagonized the inhibition effect of BBD on CCA proliferation with cisplatin treatment. (e) Representative images of flow cytometry are shown. The levels of (f) TTGSH, (g) relative activity of GLS, (h) GSH, and (i) GSH/GSSG in CCAs with YAP1 knockdown, and cisplatin/BBD co-treatment were decreased and were reversed by YAP1 overexpression (n = 5). (mean ± standard deviation) +p < 0.05, ++p < 0.01 vs. CDDP group; #p < 0.05, ##p < 0.01, vs. CDDP + BBD group.
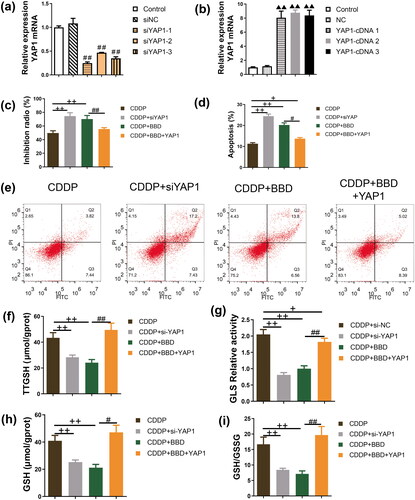
Figure 5. YAP1 Overexpression antagonized the promotional effect of babaodan (BBD) on DNA damage in cholangiocarcinoma cells with cisplatin. (a) The characteristic photos showed the DNA damage (×400, scale bar = 50 μm). The comet assay was used to measure (b) tail moment and (c) percentage of tail DNA, and YAP1 overexpression inhibited (b) tail moment and (c) percentage of tail DNA in cholangiocarcinoma cells with co-treatment of cisplatin and BBD (n = 3). (mean ± standard deviation) +p < 0.05, ++p < 0.01, vs. CDDP group; #p < 0.05, ##p < 0.01, vs. CDDP + BBD group.
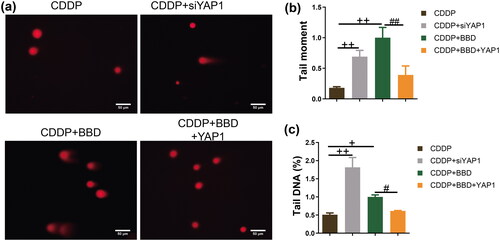
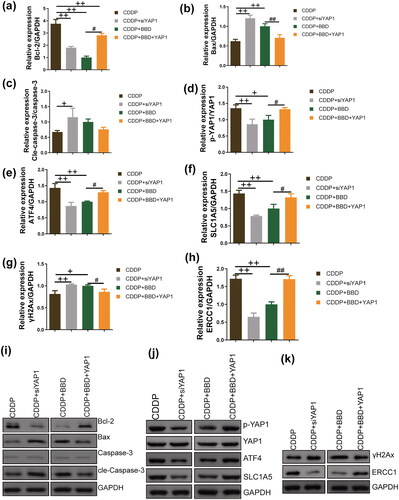
Figure 6. The extent of apoptosis, glutathione (GSH) synthesis, and the expression of DNA damage-related proteins were assessed in cholangiocarcinoma cells (CCAs) subjected to YAP1 knockdown or YAP1 overexpression. Western blot was used to measure protein levels (n = 3). With cisplatin incubation, YAP1 knockdown and 1 mg/mL babaodan (BBD) treatment decreased the (a) Bcl-2 level and (b) increased bax level, while the change in (c) cle-caspase-3/caspase-3 levels with BBD treatment was not statistically significant. In the CCAs dealing with cisplatin, the expression levels of (d) p-YAP1/YAP1, (e) ATF4, and (f) SLC1A5 were decreased by YAP1 knockdown and BBD treatment. Additionally, the (g) γH2Ax level was increased and (h) the ERCC1 level was inhibited by YAP1 knockdown and BBD treatment. YAP1 overexpression antagonized the effect of BBD on these proteins. Representative protein bands are shown in (i), (j), and (k). (mean ± standard deviation) +p < 0.05, ++p < 0.01, vs. CDDP group; #p < 0.05, ##p < 0.01, vs. CDDP + BBD group.
Supplemental Material
Download PDF (1.9 MB)Data availability statement
The authors confirm that the data supporting the findings of this study are available within its supplementary materials.