
Figures & data
Figure 1. Variation in the implementation of peace agreements, 1989–2015.
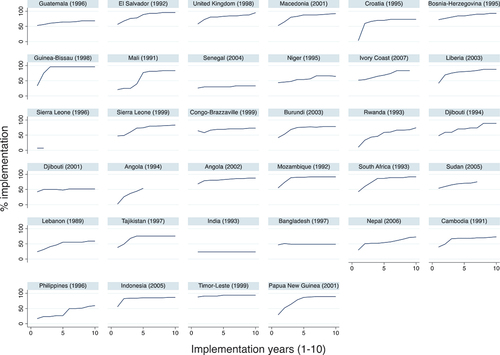
Table 1. Descriptive statistics of the variables of the study.
Figure 2. Country-wise government ideology changes.
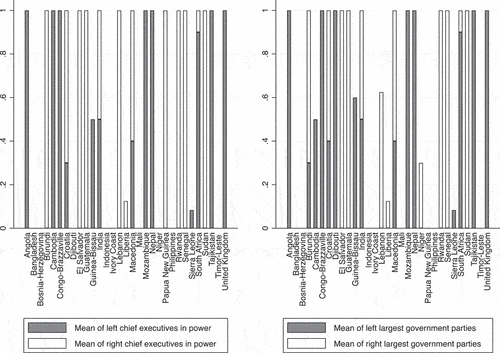
Table 2. Cross-tabulation of the chief executives’ ideology.
Table 3. Cross-tabulation of the largest government parties’ ideology.
Table 4. Effects of the chief executives’ ideology on peace agreement implementation.
Table 5. Effects of the largest government parties’ ideology on peace agreement implementation.
Figure 3. Predicted marginal effects of the chief executives’ ideology on peace agreement implementation with 95 per cent CIs.
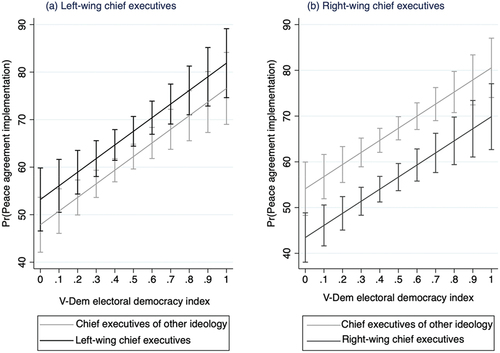
Figure 4. Predicted marginal effects of the largest government parties’ ideology on peace agreement implementation with 95 per cent CIs.
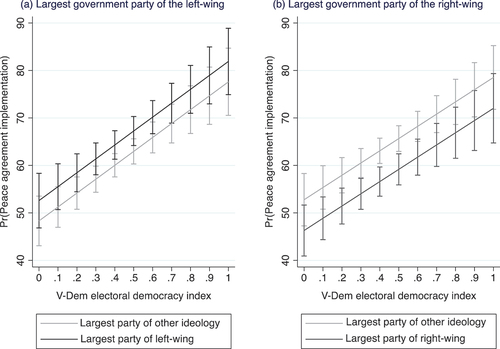
Table A1. Results of the t-test on the left-wing chief executives and peace agreement implementation.
Table B1. Results of the t-test on the right-wing chief executives and peace agreement implementation.
Table C1. Results of the t-test on the left-wing largest government parties and peace agreement implementation.
Table D1. Results of the t-test on the right-wing largest government parties and peace agreement implementation.