
Figures & data
Figure 1. Wrist limb rehabilitation, (a) wearable robotic device for wrist rehabilitation (Pehlivan et al., Citation2014), (b) degrees of freedom in human body upper limb.
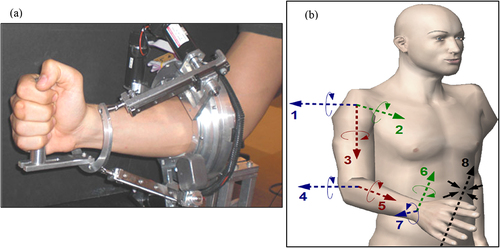
Figure 2. (a) CAD depiction of the wrist rehab robot, (b) SolidWorks simulation of the robot at 80° pronation, (c) 3D printed hand brace for the robot, (d) assembled 3D printed robot prototype, shown standalone and with a human user.
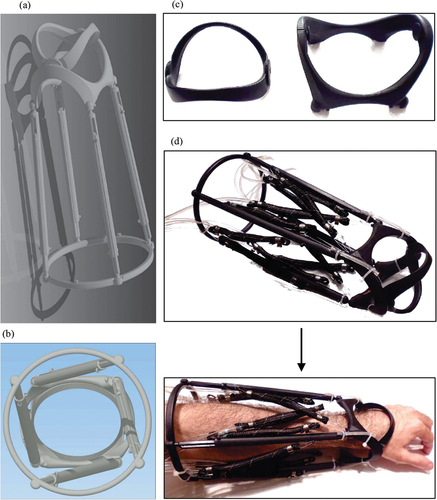
Table 1. Survey questions and responses for evaluating traditional teaching efficacy.
Table 2. Survey questions and response choices for assessing the impact of 3D printing in the course.
Figure 3. SOLO taxonomy framework for assessing student evaluations (Biggs & Collis, Citation2014).
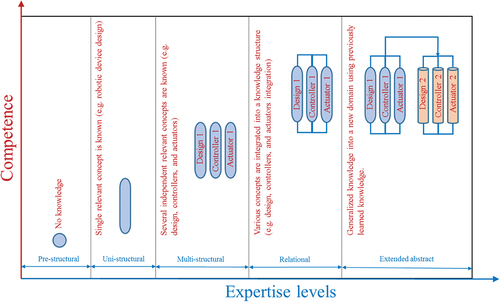
Table 3. Distribution of responses to student survey questions.
Table 4. Distribution of the number of students who agreed and disagreed.
Figure 4. Distribution of responses from survey I prior to the mid-term exam (a), and prior to the final exam (b).
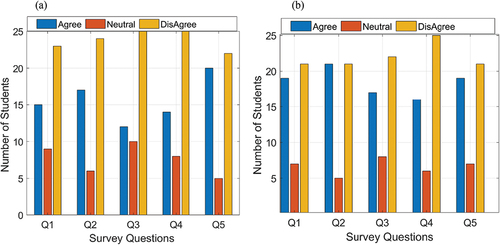
Figure 5. Distribution of responses from survey II conducted prior to the mid-term exam (a), and prior to the final exam (b).
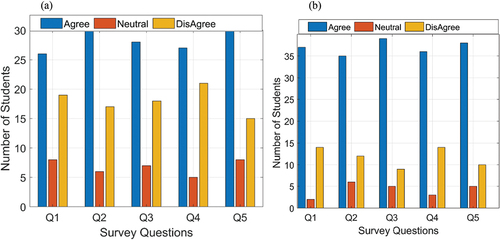
Table 5. Student’s scores and their dispersion.
Figure 6. Comparison of student scores under the traditional and 3D printing teaching methods.
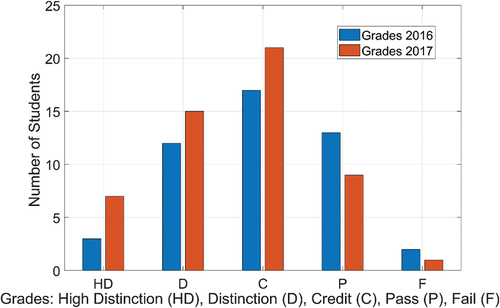
Table 6. Results from the Mann-Whitney U test.