
Figures & data

Figure 1. Countries and case study regions of this study.
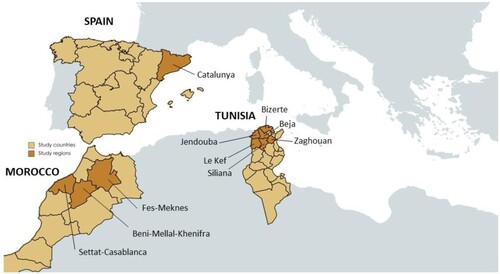
Figure 2. Analytical steps performed for the mental model analyses.
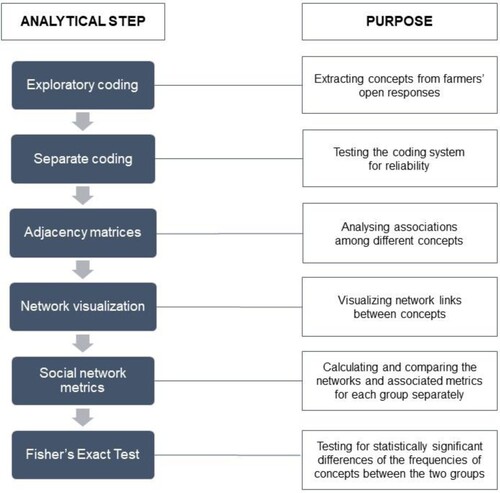
Table 1. Top ten concepts in overall concept network of good soil management.
Table 2. Top ten concepts in the ‘good soil management’ concept networks for both tillage groups. Frequency refers to the number of farmers that mentioned the concept. For simplicity, only the prominence value is reported here.
Figure 3. Overall mental model of ‘good soil management’ for all farmers. Size of node indicates prominence value of concept.
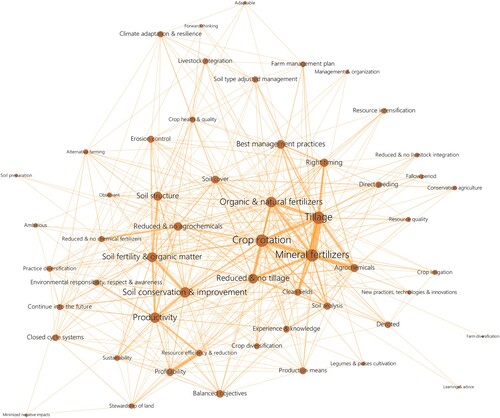
Table 3. Top ten concepts in overall concept network of ‘good farmer’ identity.
Figure 4. Mental models of good soil management for CA (left) and conventional tillage (right) farmers, indicating the most prominent concepts. Size of node indicates prominence value of concept.
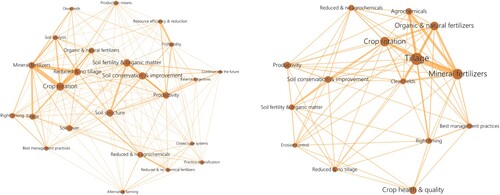
Figure 5. Overall mental model of ‘good farmer’ identity for all farmers. Size of node indicates prominence value of concept.
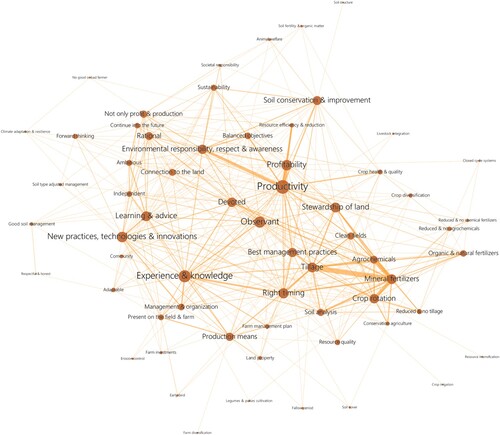
Table 4. Top ten concepts in ‘good farmer’ concept network for both tillage groups. Frequency refers to the number of farmers that mentioned the concept. For simplicity only the prominence value is reported here.
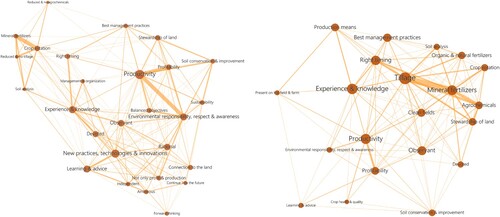
Figure 6. Mental models of ‘good farmer ‘identity for CA (left) and conventional tillage (right) farmers indicating most prominent concepts. Size of node indicates prominence value of concept.
Good_Soil_Good_Farmer_Appendix.docx
Download MS Word (31.1 KB)Data availability statement
The data is available upon request to the authors.