
Figures & data
Figure 1. Average temperature map of the study area.
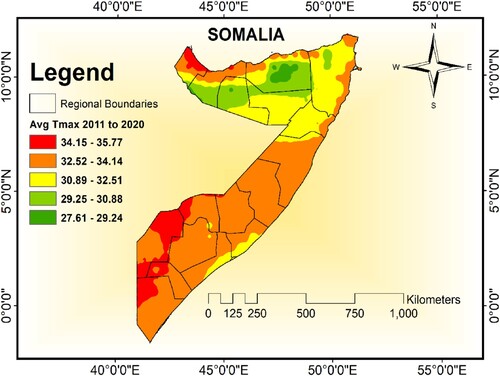
Figure 2. Trend of major crops production and harvested areas.
Notes: (a) Maize (b) Sorghum (c) Rice (d) Wheat (e) Sugarcane (f) Banana (g) Beans. Data source: FAO (Citation2022).
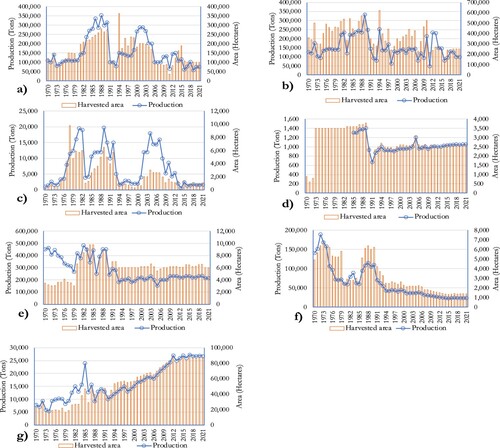
Table 1. Variables, code, measurement unit, and sources.
Table 2. Descriptive statistics and correlation matrix.
Table 3. Unit Root Tests.
Table 4. F-bounds test cointegration results.
Table 5. Long-Run Coefficient Estimates.
Table 6. Short-Run Coefficient Estimates.
Table 7. Diagnostic tests.
Table 8. Pairwise Granger Causality Tests.
Data availability
The datasets used and/or analyzed during the current study are available from the author on reasonable request.