115
Views
0
CrossRef citations to date
0
Altmetric
Research Article

Translating the complexity of EU differentiation: a comparative analysis of news coverage in Germany, Denmark, and the UK

, &
Received 29 Aug 2023, Accepted 22 Apr 2024, Published online: 09 May 2024

Figures & data

Table 1. List of events and dates behind the time frame for analysis.

Table 2. Case selection, and the correspondent with highest number of articles per outlet.

Figure 1. Share of sentences with statements related to differentiation, dominance, or democracy in the EU.
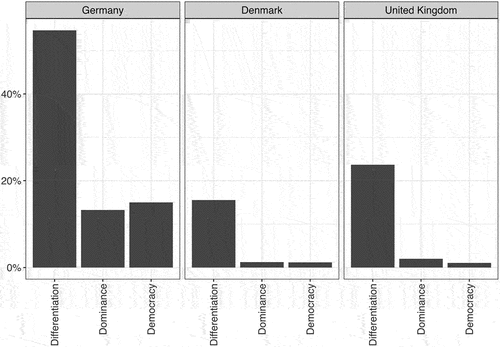
Figure 1. Share of sentences with statements related to differentiation, dominance, or democracy in the EU.

Figure 2. Share of differentiation types in news articles. Note: As a single sentence can contain statements about more than one type of differentiation, the sums of shares do not equal to 100%.
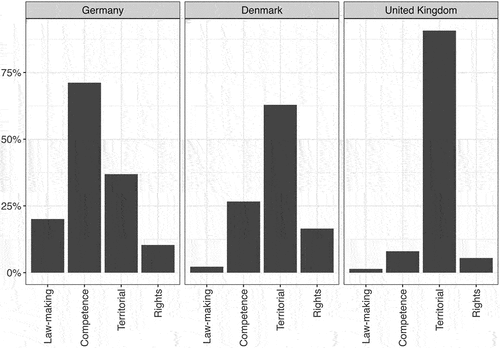
Figure 2. Share of differentiation types in news articles. Note: As a single sentence can contain statements about more than one type of differentiation, the sums of shares do not equal to 100%.

Figure 3. Share of sources of differentiation-related statements in news articles. Note: As a single sentence can contain statements from more than one source, the sums of shares do not equal to 100%.
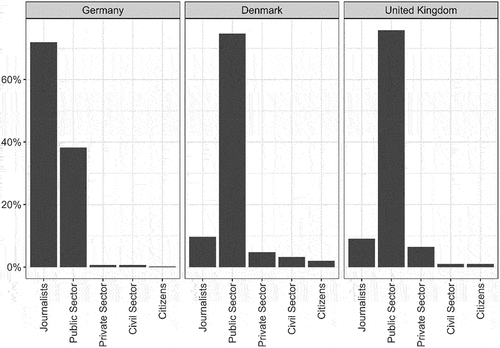
Figure 3. Share of sources of differentiation-related statements in news articles. Note: As a single sentence can contain statements from more than one source, the sums of shares do not equal to 100%.

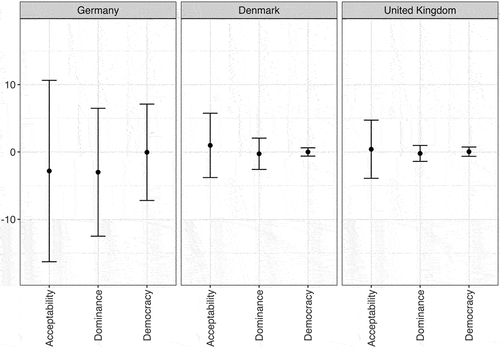
Figure 4. Average evaluations in news articles. Note: error bars represent standard deviations.

Figure 4. Average evaluations in news articles. Note: error bars represent standard deviations.

Table 3. Ordinal logistic regression models.

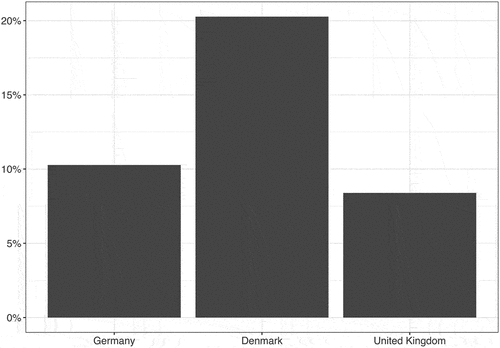
Figure A1. Share of migration-related sentences, among those coded as related to differentiation, democracy, or dominance in the first place.

Figure A1. Share of migration-related sentences, among those coded as related to differentiation, democracy, or dominance in the first place.

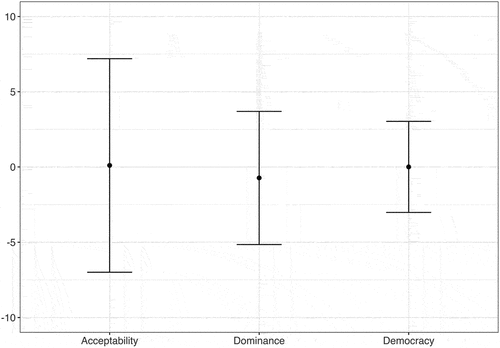
Figure A2. Average evaluations per news article. Note: error bars represent standard deviations.

Figure A2. Average evaluations per news article. Note: error bars represent standard deviations.