Figures & data
Table 1 Characteristics of the patients
Figure 1 Expression of TGF-β isoforms in COPD lung tissue. Relative mRNA expression levels of TGF-β 1-3 (A), CTGF and PAI-1 (B) in control and COPD IV lung tissues as analyzed by quantitative real-time RT-PCR. The mRNA levels were normalized to the expression levels of a control gene (TBP, tata binding protein) and are expressed relative to control-1 (set to 1). The error bars represent standard error of the mean of the samples (n = 5).*, p < 0.05.
Figure 2 P-Smad2 staining of emphysematous alveolar septal areas and bronchiolar epithelium. Paraffin sections from control adult, COPD II-III and COPD IV patient lungs were immunostained for P-Smad2. A. Emphysematous alveolar septal (upper panels) and bronchiolar (lower panels) areas are shown. Positive staining is reddish-brown. Scale bar = 100 μ m. B. Quantification of P-Smad2 positive nuclei. The results are presented as boxplots.*, p = 0.028;**, p = 0.006.
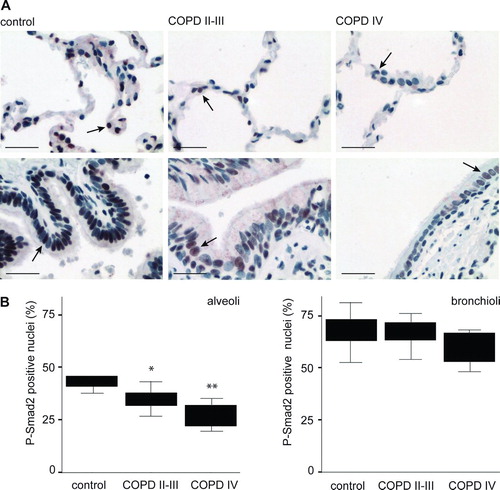
Figure 3 P-Smad2 positive nuclei in peribronchiolar lung. A. Representative Masson's Trichrome staining of control adult and COPD lungs. Collagen fibers stain blue. B. Representative P-Smad2 staining of a patient with stage II COPD. A small airway with peribronchiolar thickening and inflammation is shown. The positive nuclear staining is reddish-brown. Scale bar = 100 μ m. C. Quantification of P-Smad2 positive nuclei in the peribronchiolar area of small airways from the different patient groups. The results are presented as boxplots.*, p = 0.025;**, p = 0.01.
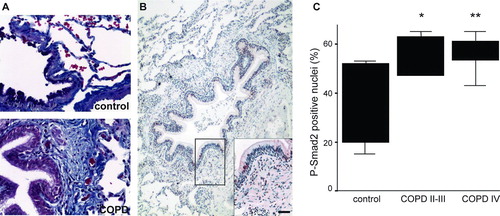
Figure 4 Lung fibroblasts (CCL-190 normal adult and COPD fibroblasts) were transiently transfected with a TGF-β responsive (CAGA)12-luciferase promoter construct and cultured for two days. Luciferase activities were measured and normalized by comparing them with the activities of co-transfected Renilla luciferase activities. The results are expressed as relative luciferase activities. B. Relative mRNA expression levels of CTGF and PAI-1 in control and COPD fibroblasts as analyzed by quantitative real-time RT-PCR. The mRNA expression levels were normalized to the expression levels of a control gene (TBP, tata binding protein) and are expressed relative to control (set to 1). The error bars represent the standard error of the mean of the samples (COPD fibroblast, n = 3).*, p < 0.05.