
Figures & data
Table 1. Demographic information from the five studies and the separate healthy volunteer cohort. Categorical data are given as a number with its percentage of the total (n (%)). continuous data given as (median (Q1-Q3)). for the COPD classification dataset, smoking history and pack years were absent for 82 and 281 participants respectively. For the severity determination dataset, smoking history and pack years were absent for 2 and 16 participants respectively.
Table 2. Aggregated machine learning model performance on all 5 unseen outer-loop test sets, for each of the three models built: logistic regression (LR), extreme gradient boosted trees (XGBoost), and support vector machine (SVM) with an RBF kernel.
Table 3. Accuracy of COPD/non-COPD diagnosis for most commonly presenting disease groups and all COPD severities, over all five outer-loop test sets.
Figure 1. High-level overview of the data processing pipeline applied to the fast-response CO2 data collected through the N- TidalTM device.
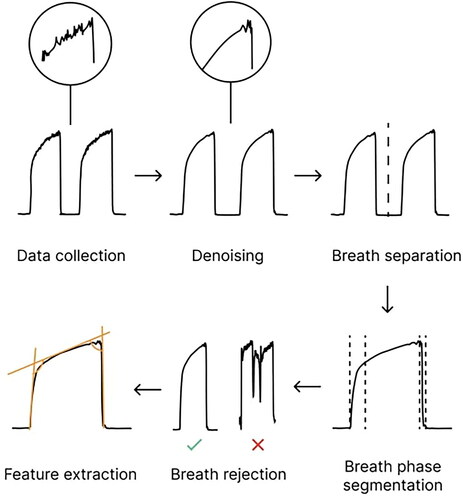
Figure 2. Illustration of a capnogram waveform and its phases and angles. Phase 1 is the inspiratory baseline, Phase 2 is the expiratory upstroke (representing the first phase of exhalation), Phase 3 is the expiratory plateau (representing the majority of exhalation), Phase 4a is the inspiratory downstroke (representing the first phase of inhalation), and Phase 4b is the inspiratory baseline. Note that the start of Phase 1 and the end of Phase 4b may technically be considered part of the same phase.
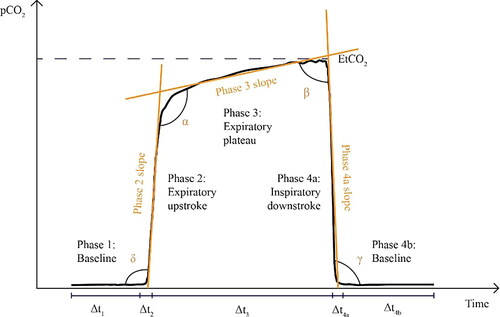
Figure 3. (A) Receiver operating characteristic (ROC) curve for the LR model, reported with results of a theoretical ‘random’ classifier with no predictive power. (B) Precision-Recall Curve for the LR model, reported with the results of a theoretical ‘random classifier’ and the average precision (AP).
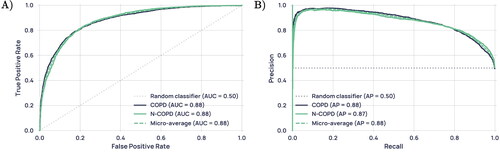
Figure 4. Diagnostic performance on the full test set and the highly confident regions only.
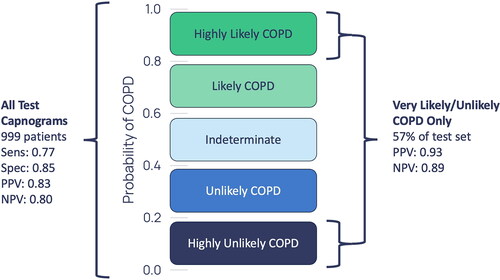
Table 4. Diagnostic accuracy and standard deviation across test-sets for the most prevalent COPD comorbidities. Comorbid COPD patients who had bronchiectasis/HF/long COVID/pneumonia and other lung conditions were placed in the COPD and other(s) category.
Figure 5. Average weighted feature importance by capnogram waveform region, where weighted features were calculated as the magnitude of the product of the standardised feature value and the feature importance. (A) shows an example for a non-COPD waveform, and (B) shows an example for a COPD waveform.
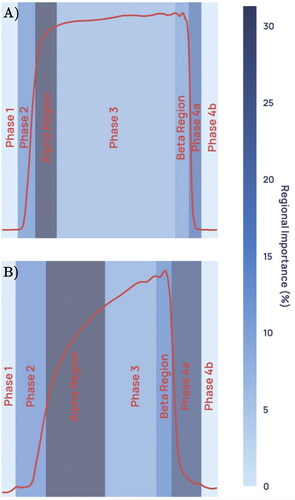
Figure 6. Capnogram waveforms averaged across all healthy, asthma and COPD subjects in the dataset and normalised to equal width and height.
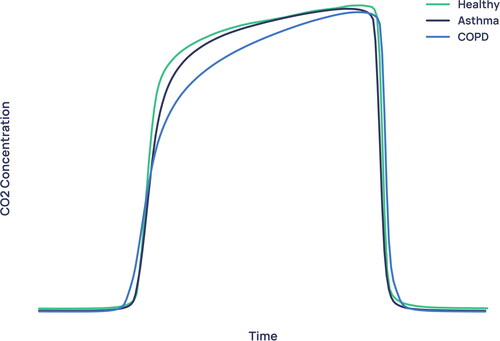
Figure 7. Boxplot showing the distribution of each GOLD stage in the severity model’s probability output.
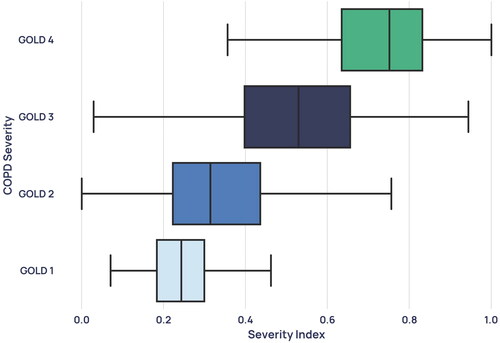
Figure 8. Average waveforms, where (A) and (B) are two GOLD 1 examples with the corresponding confidences and (C) and (D) show two GOLD 2 examples with the corresponding confidences. (A) and (C) are examples with low prediction confidence for their severity and (B) and (D) are examples with high prediction confidence for their severity.
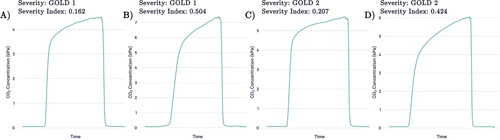
Figure 9. Capnogram waveforms averaged across all patients of each severity in the dataset and normalised to equal width and height.
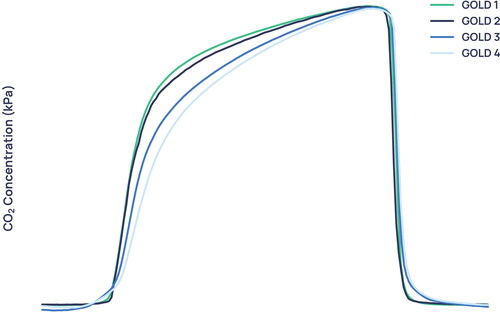
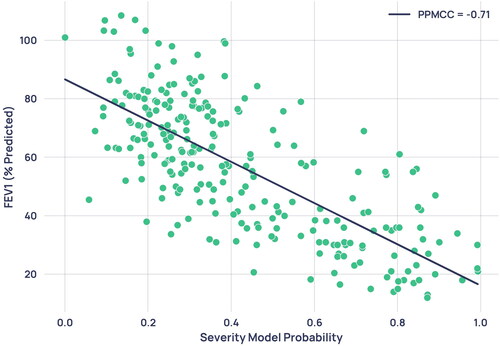
Figure 10. Scatterplot of severity model output probability against percentage predicted FEV1 from paired spirometry data. Each point represents a single paired capnogram. The correlation coefficient was -0.71.
Supplemental Material
Download PDF (890.7 KB)Availability of data and materials
The datasets generated during and/or analysed during the current study are not publicly available for data protection reasons.