
Figures & data
Figure 1. Overview of MR analyses process and major assumptions.
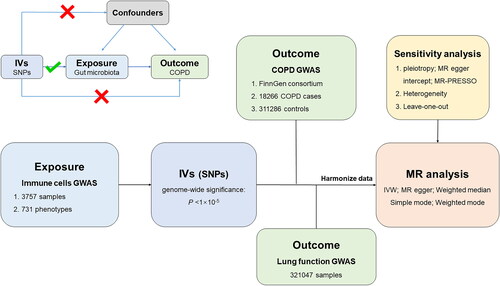
Figure 2. MR results of immune cell signatures with a causal relationship to COPD. From the inner to outer circles, they represent the p-value of weighted mode, simple mode, weighted median, MR-Egger, and inverse-variance weighted methods, respectively. The shades of color reflect the magnitude of the pvalue.
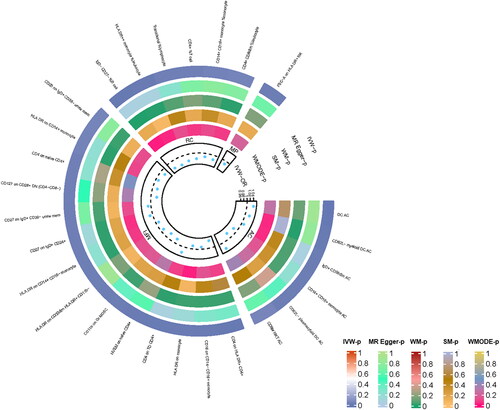
Figure 3. Forrest plot for summary causal effects of seven immune cell signatures on COPD risk.
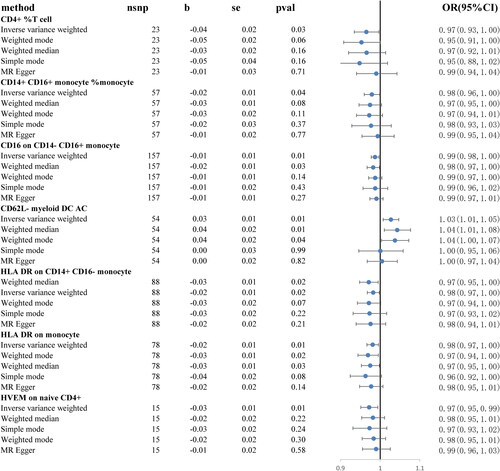
Figure 4. Scatter plots of the MR analyses for the association of immune cell signatures and the risk of COPD.
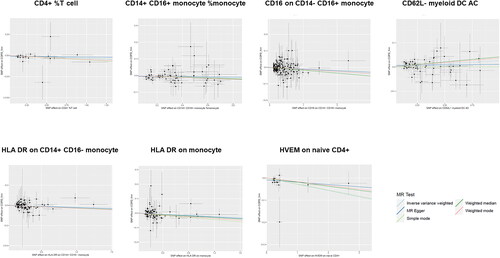
Figure 5. Schematic diagram illustrating how immune cells act on the airways.
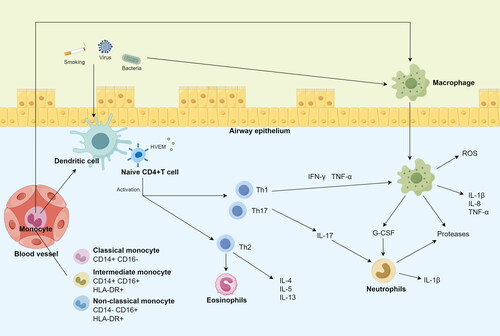
Table 1. The functions of these seven immune cells.
Supplemental Material
Download Zip (11 MB)Data availability
The data that supports the findings of this study are available upon reasonable request from the corresponding author.