
Figures & data
Table 1. Properties and its magnitude for polylactic acid (Jaiinder, Singh, and Dhawan Citation2019b).
Table 2. Properties and its magnitude for kenaf fiber (Jaiinder, Singh, and Dhawan Citation2019b).
Figure 1. Surface treatment of kenaf fiber with a). alkali b). Potassium permanganate and c). Potassium dichromate solutions d). Alkali treated kenaf/PLA composite.
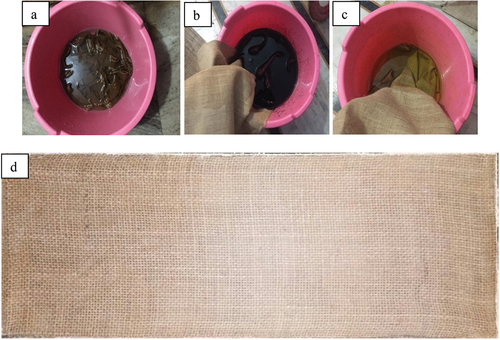
Figure 2. Process for developing a kenaf/PLA biocomposites.
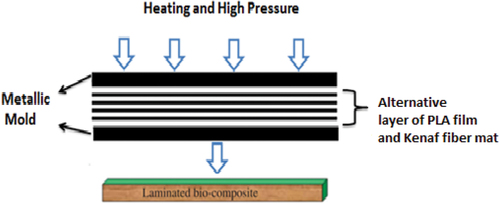
Figure 3. A) barcol hardness test specimen b) barcol hardner tester.
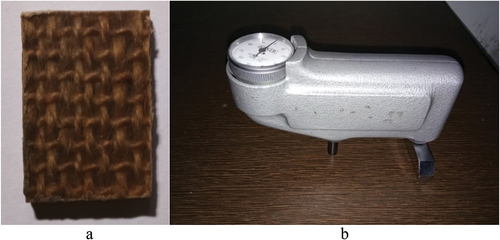
Figure 4. FTIR Spectra of a) untreated kenaf fiber b) all surface treated kenaf fiber.
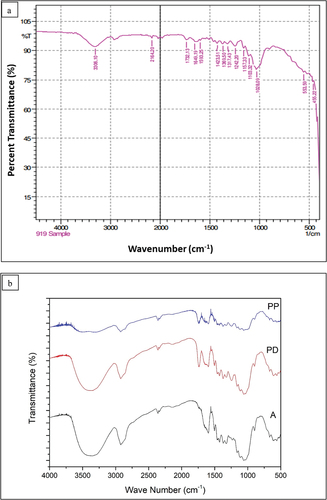
Table 3. FTIR transmittance readings for untreated and surface-treated kenaf fibers.
Figure 5. Influence of fiber loading on tensile strength.
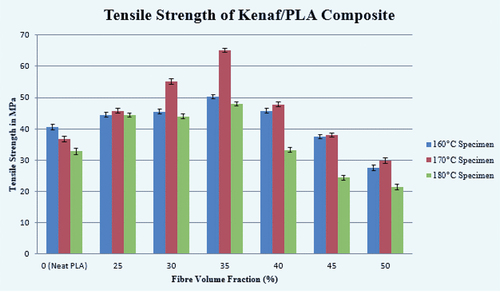
Figure 6. Young’s modulus of Kenaf/PLA composites.
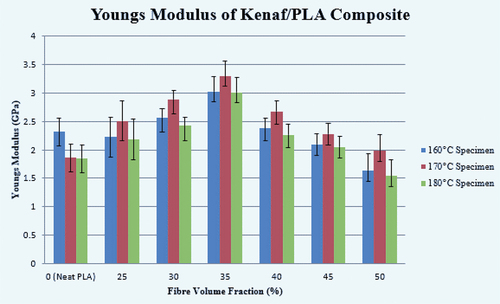
Figure 7. SEM images of tensile failed specimens of kenaf reinforced PLA-based bio-composites for (a) 160°C (b) 170°C and (c) 180°C at 500× magnifications respectively.
Figure 8. Tensile fractured Kenaf/PLA composite specimens as depicted in a SEM picture that was obtained at 170°C with a) 35% fiber volume percent, b) 50% fiber volume percent at 750× magnification respectively.
Figure 9. Surface treatment’s impact on a surface’s tensile strength PLA/Kenaf composites.
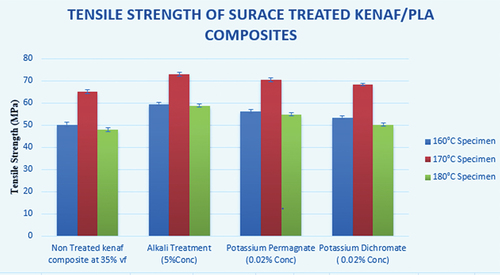
Figure 10. Result of surface treatment on Young’s modulus of Kenaf/PLA composites.
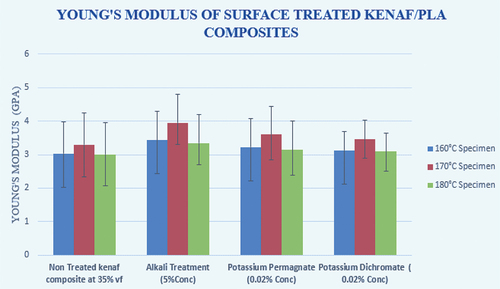
Figure 11. Flexural strength of kenaf reinforced PLA composites.
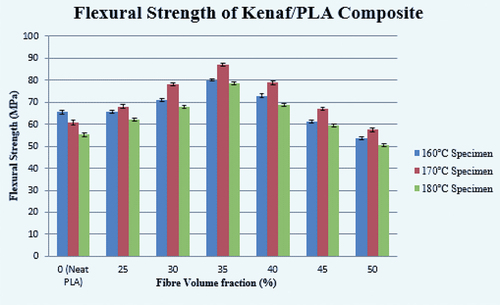
Figure 12. Kenaf/PLA composites’ flexural modulus.
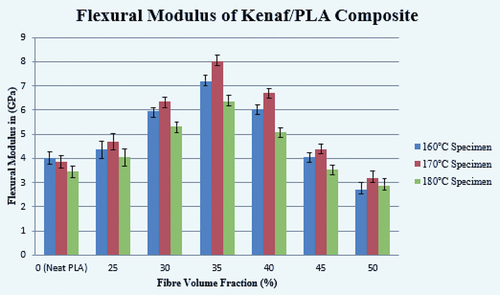
Figure 13. Flexural strength of surface-treated kenaf/PLA composites.
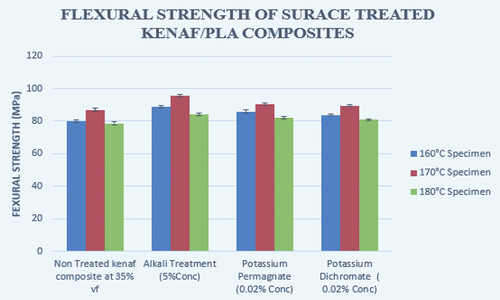
Figure 14. Flexural modulus of surface treated kenaf/PLA composites.
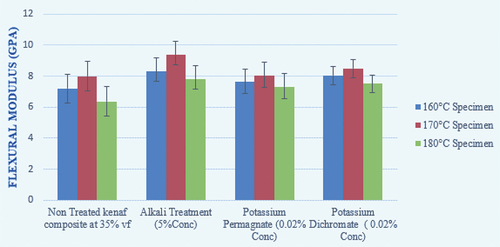
Figure 15. Variation in the hardness of Kenaf/PLA composites.
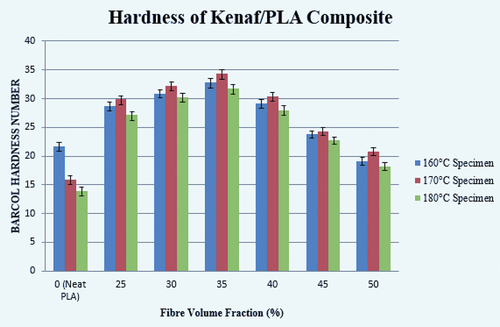
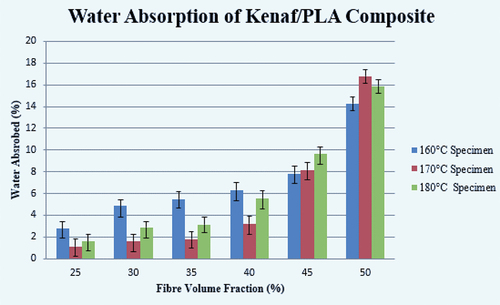
Figure 16. Variation in water absorption of kenaf/PLA composites.
Data availability statement
My manuscript has no associate data.