Figures & data
Figure 1. Waste chicken feathers after washing and drying.
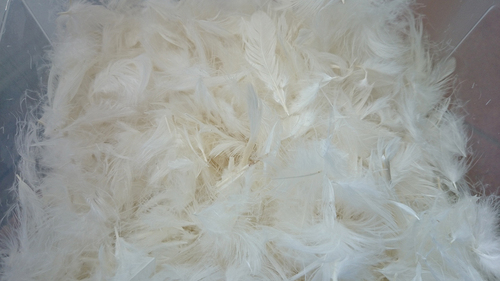
Figure 2. Composite pillows made from loose feathers and sepiolite in PET fabric.
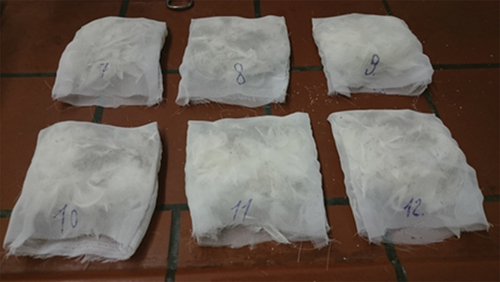
Figure 3. Composite sample (FS-sheet) prepared from feathers and sepiolite.
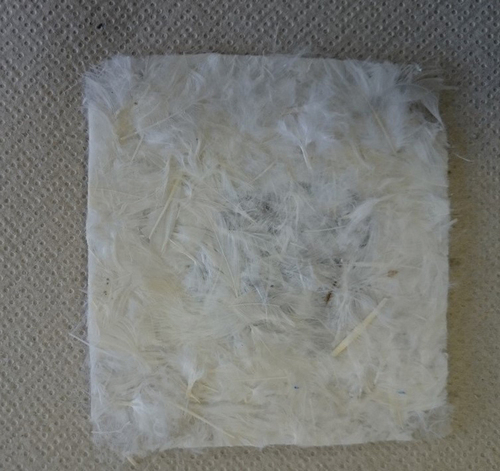
Table 1. Designations and composition of the samples.
Figure 4. Scanning electron micrographs of chicken feathers: whole feather (a), rachis and barb (b), barbules (c and d).
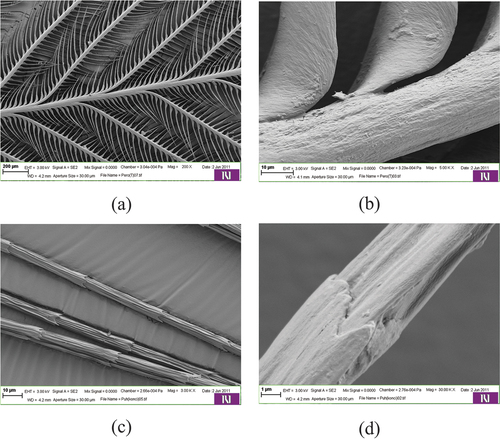
Figure 5. Scanning electron micrographs of cross-sections of a barb (a) and barbule (b) showing the details of the walls of the internal “honeycomb” structure (c and d).
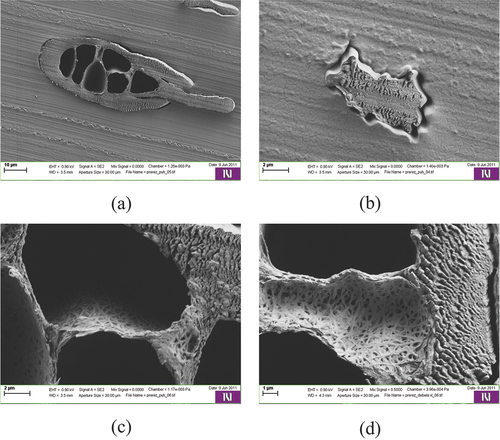
Figure 6. Scanning electron micrographs of the sepiolite specimen at 50x (a) and 2500x (b) magnification.
Figure 7. FTIR spectrum of chicken feathers.
Figure 8. The FTIR spectrum of the sepiolite sample.
Figure 9. Zeta potential as a function of pH for feather marked as x) and sepiolite (marked as o) samples.
Table 2. Viscosity (η), Density (ρ), Surface tension (SFT) of test liquids and their corresponding dispersive (Dis) and polar (Pol) contributions, and polarity.
Table 3. The surface tension ( and its dispersive (
and polar (
contributions of sample diesel oil.
Table 4. The total surface free energies (SFE) and their dispersive and polar contributions estimated by OWRK model for sepiolite (S), feathers (F) and polyester fabric (PET).
Table 5. Gibbs free energy of wetting (G) and work of adhesion (Wsl) for the solid/liquid systems (feathers/oil (F/oil) and sepiolite/oil (S/oil)).
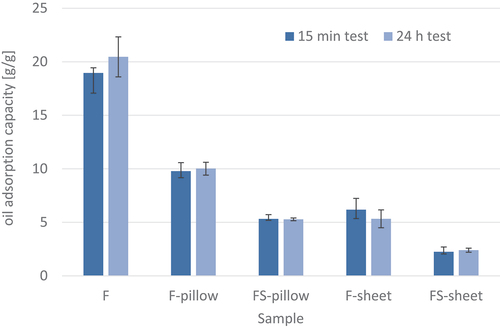
Figure 10. The oil adsorption capacity as mass ratio of oil adsorbed to dry adsorbent weight of loose feathers (F), pillow composites (F-pillow, FS-pillow) and sheet composites (F-sheet, FS-sheet).