
Figures & data
Figure 1. Schematic of natural and synthetic tRNALeu variants.
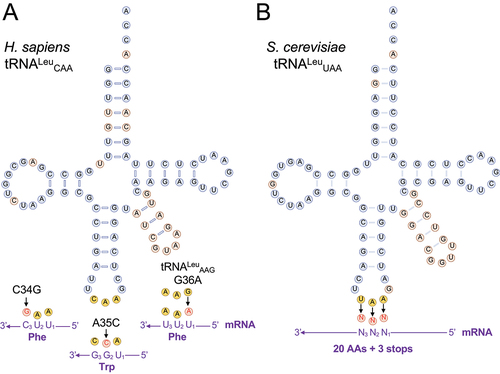
Table 1. Naturally occurring human tRNALeu variants characterized in this study.
Figure 2. Identification of Leu mis-incorporation in mammalian cells by tandem mass spectrometry.
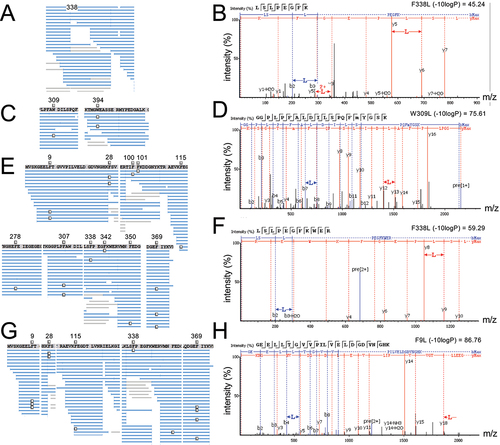
Table 2. Summary of Leu mis-incorporation identified by MS/MS in mammalian cells.
Figure 3. OTTR-seq analysis of N2a cells expressing wild-type human tRNA or anticodon variants.
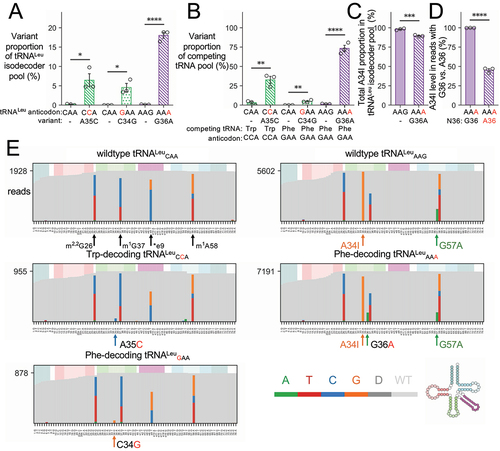
Figure 4. Global protein synthesis levels in cells expressing tRNA variants.
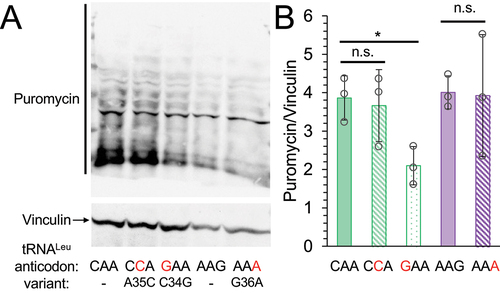
Figure 5. eGFP fluorescence and cytotoxicity in normal and mistranslating cells under proteasome inhibition.
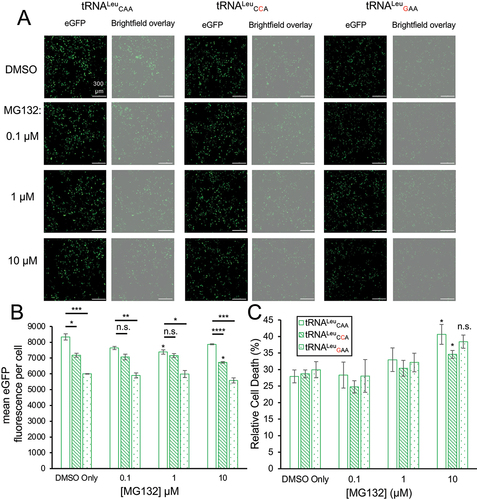
Figure 6. Impact of tRNALeu anticodon variants on yeast growth.
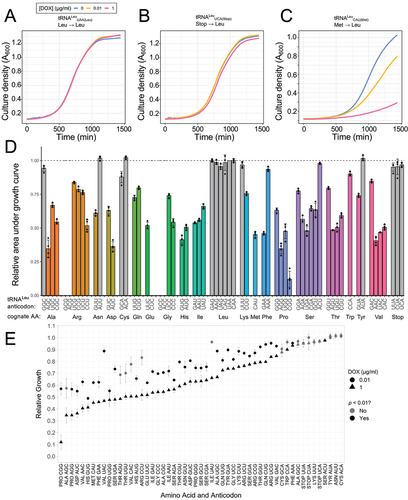
Figure 7. Identification of Leu mis-incorporation in yeast by tandem mass spectrometry.
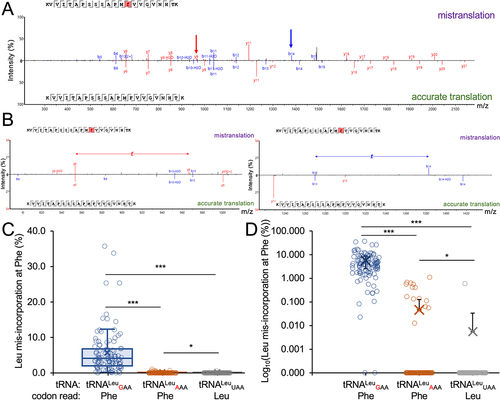
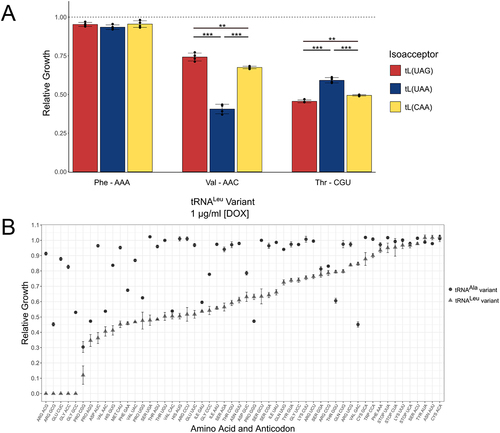
Figure 8. Relative growth of yeast strains with tRNALeu anticodon variants.
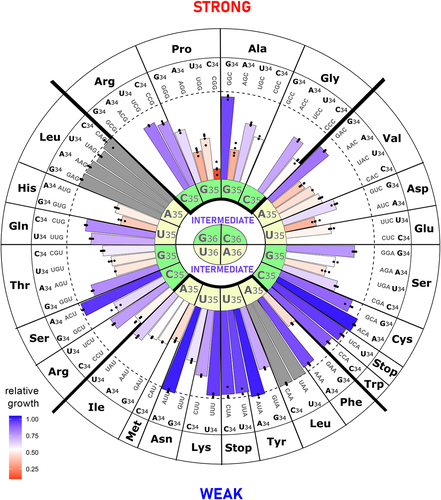
Figure 9. Analysis of anticodon variants in different contexts.
DataFile1.csv
Download Comma-Separated Values File (341.1 KB)DataFile3.csv
Download Comma-Separated Values File (54.8 KB)DataFile4.csv
Download Comma-Separated Values File (6.8 KB)DataFile2.csv
Download Comma-Separated Values File (30.8 KB)tRNALeu_2023SI_R1.docx
Download MS Word (14.4 MB)Data availability statement
All data are available in the figures, tables, supplementary information, and Supplementary Data Files 1–4.
All MS/MS data files are available:
https://figshare.com/articles/dataset/Mass_spec_tRNALeu_2023_zip/23284907/1
https://bioinfor.sharefile.com/d-sb232430cb59d423c99b1cb5e3b492e58
OTTR-seq data files are available at NCBI BioProject database
http://www.ncbi.nlm.nih.gov/bioproject/1066329
SubmissionID:SUB14155213
BioProject ID: PRJNA1066329