
Figures & data
Figure 1. Chemical structures of PFAS discussed in this review. Structures were made using ChemDraw professional (v16.0.1.4) and standard international union of pure and applied chemistry (IUPAC) nomenclature. Structures are organized according to a previously described scheme (Wang et al. Citation2017).
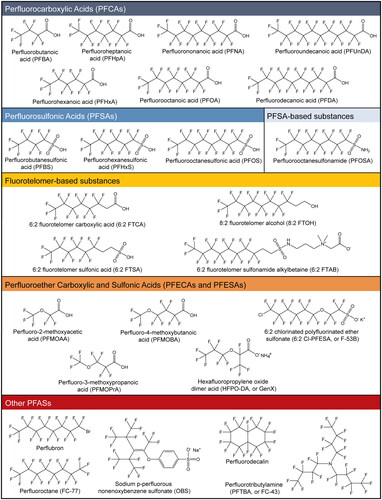
Table 1. Summary of innate immune modulation associated with exposure to PFASs in humans, primary human leukocytes, and human cell lines.
Table 2. Summary of innate immune modulation by exposure to PFASs in experimental mammals.
Table 3. Summary of innate immune modulation by exposure to PFASs in zebrafish.
Table 4. Summary of innate immune modulation by exposure to PFASs in wildlife and ecotoxicological models.
Figure 2. Visual summary of mechanisms of PFAS toxicity observed in monocytes, microglia, and macrophages. PFAS have been shown to disrupt immune signaling and other pathways in (A) monocytes (Corsini et al. Citation2011, Citation2012, Citation2021; Racchi et al. Citation2017; Masi et al. Citation2022), (B) microglia (Yang et al. Citation2015; Wang et al. Citation2015; Zhu et al. Citation2015; Ge et al. Citation2016; Lin et al. Citation2022), and (C) macrophages (Chang et al. Citation2005; Miyano et al. Citation2012; Kong et al. Citation2019; Wang, Liu et al. Citation2021; Tian et al. Citation2021; Yu et al. Citation2022; Lee et al. Citation2022; Wang, Tan, et al. Citation2023). Black arrows and red lines with a ‘T’ end indicate normal function (activating and inhibiting, respectively). PFAS-induced endpoints for each gene/protein are shown graphically as red up arrows (increase in signal and/or expression), blue down arrows (decrease in signal/expression), dash (no observed change), checkmark (binding between protein and any PFAS observed in vitro), checkmark with question mark (binding between protein and any PFAS suggested in silico, but not demonstrated in vitro). Details are provided in Supplemental Table S1. AIM2: absent in melanoma 2; arg-1: Arginase 1; ASC: Apoptosis-associated speck-like protein containing a CARD; BAK: Bcl-2 homologous antagonist killer; BAX: Bcl-2-associated X protein; BCL-2: B-cell lymphoma 2; BIP: Binding immunoglobulin protein; Casp1: Caspase 1; Casp3: Caspase 3; CCL2: Chemokine ligand 2, also called MCP-1; CXCL1: Chemokine (CXC motif) ligand 1; CD: Cluster of differentiation (multiple types); COX2: Cytochrome c oxidase II; cyt C: Cytochrome C; ERK: Extracellular signal-regulated kinase; H2-Aa: Histocompatibility 2, class II antigen A, alpha; H2-K1: histocompatibility 2, K1, K region; IFNγ: interferon-γ; IκB: nuclear factor of κ-light polypeptide gene enhancer in B-cells inhibitor; IL: Interleukin (several types); iNOS: Inducible nitric oxide synthase; JNK: c-Jun N-terminal kinase; KO: knockout; LPS: Lipopolysaccharide; MAPK: Mitogen-activated protein kinase; MMP9: Matrix metallopeptidase-9; mtDNA: Mitochondrial DNA; NF-κB: Nuclear factor κ-light-chain-enhancer of activated B-cells; NLRP3: NOD-like receptor family pyrin domain containing 3; OPN: Osteopontin; PARP: Poly (ADP-ribose) polymerase; PGE-2: Prostaglandin E2; PI3K: Phosphoinositide 3-kinase; PKCβ: protein kinase Cβ; PPARα: peroxisome proliferator-activated receptor-α; RACK1: Receptor for activated C kinase 1; RCS: Reactive carbonyl species; ROS: Reactive oxygen species; STAT3: Signal transducer and activator of transcription-3; TNFα: tumor necrosis factor-α.
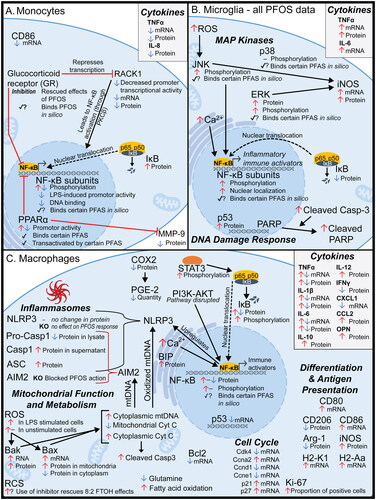
Figure 3. Visual summary of mechanisms suggested in tissue-level, acellular, and other studies not specifically in innate immune cells. PFAS have been shown to disrupt (A) Toll-like receptor signaling (Singh et al. Citation2012; Zhang et al. Citation2014; Zhang et al. Citation2021; Sheng et al. Citation2017; Chen et al. Citation2018; Han et al. Citation2018b; Castaño-Ortiz et al. Citation2019; Guo et al. Citation2019; Shane et al. Citation2020; Zhang et al. Citation2020; Zhong et al. Citation2020; Xie et al. Citation2021; Huang et al. Citation2022; Wan et al. Citation2022; Xu et al. Citation2022; Liu et al. Citation2023, Tang et al. Citation2023) and (B) PPAR signaling (Corsini et al. Citation2012; Pennings et al. Citation2016; Sheng et al. Citation2017; Wu et al. Citation2017; Rodríguez-Jorquera et al. Citation2019; Shane et al. Citation2020; Christofides et al. Citation2021; Khazaee et al. Citation2021; Weatherly et al. Citation2021; Zhang, Dong, et al. Citation2021; Camdzic et al. Citation2022, Chen et al. Citation2022; Evans et al. Citation2022; Wang et al. Citation2022; Xu et al. Citation2022; Sun et al. Citation2023), but the effect of PFAS on these pathways in innate immune cells remained understudied. Black arrows and red lines with a ‘T’ end indicate normal function (activating and inhibiting, respectively). PFAS-induced endpoints for each gene/protein are shown graphically as red up arrows (increase in signal/expression), blue down arrows (decrease in signal/expression), checkmark (binding between protein and any PFAS observed in vitro), checkmark with question mark (binding between protein and any PFAS suggested in silico, but not demonstrated in vitro). Details are provided in Supplemental Table S1. Abbreviations: CD36: Cluster of differentiation 36; E-FABP: Fatty acid binding protein [epidermal type]; HMGB1: High mobility group box 1 protein; IκB: Nuclear factor of κ-light polypeptide gene enhancer in B-cells inhibitor; IRAK: IL-1 receptor-associated kinase; MyD88: Myeloid differentiation primary response 88; NF-κB: Nuclear factor κ-light-chain-enhancer of activated B-cells; PPAR: Peroxisome proliferator-activated receptor; TLR: Toll-like receptor; TRAF6: TNF receptor associated factor-6.
![Figure 3. Visual summary of mechanisms suggested in tissue-level, acellular, and other studies not specifically in innate immune cells. PFAS have been shown to disrupt (A) Toll-like receptor signaling (Singh et al. Citation2012; Zhang et al. Citation2014; Zhang et al. Citation2021; Sheng et al. Citation2017; Chen et al. Citation2018; Han et al. Citation2018b; Castaño-Ortiz et al. Citation2019; Guo et al. Citation2019; Shane et al. Citation2020; Zhang et al. Citation2020; Zhong et al. Citation2020; Xie et al. Citation2021; Huang et al. Citation2022; Wan et al. Citation2022; Xu et al. Citation2022; Liu et al. Citation2023, Tang et al. Citation2023) and (B) PPAR signaling (Corsini et al. Citation2012; Pennings et al. Citation2016; Sheng et al. Citation2017; Wu et al. Citation2017; Rodríguez-Jorquera et al. Citation2019; Shane et al. Citation2020; Christofides et al. Citation2021; Khazaee et al. Citation2021; Weatherly et al. Citation2021; Zhang, Dong, et al. Citation2021; Camdzic et al. Citation2022, Chen et al. Citation2022; Evans et al. Citation2022; Wang et al. Citation2022; Xu et al. Citation2022; Sun et al. Citation2023), but the effect of PFAS on these pathways in innate immune cells remained understudied. Black arrows and red lines with a ‘T’ end indicate normal function (activating and inhibiting, respectively). PFAS-induced endpoints for each gene/protein are shown graphically as red up arrows (increase in signal/expression), blue down arrows (decrease in signal/expression), checkmark (binding between protein and any PFAS observed in vitro), checkmark with question mark (binding between protein and any PFAS suggested in silico, but not demonstrated in vitro). Details are provided in Supplemental Table S1. Abbreviations: CD36: Cluster of differentiation 36; E-FABP: Fatty acid binding protein [epidermal type]; HMGB1: High mobility group box 1 protein; IκB: Nuclear factor of κ-light polypeptide gene enhancer in B-cells inhibitor; IRAK: IL-1 receptor-associated kinase; MyD88: Myeloid differentiation primary response 88; NF-κB: Nuclear factor κ-light-chain-enhancer of activated B-cells; PPAR: Peroxisome proliferator-activated receptor; TLR: Toll-like receptor; TRAF6: TNF receptor associated factor-6.](/cms/asset/d6a385c2-afbb-488d-b9fe-0e9b070a9dcb/iimt_a_2343362_f0003_c.jpg)