
Figures & data
Figure 1. The vegetation types on the Tibetan Plateau. The blank region, identified by multiyear mean annual NDVI values below 0.10, was emblematic of sparse vegetation. The vegetation types was derived from vegetation map of the People’s Republic of China (1:1000000) (X. Zhang Citation2007).
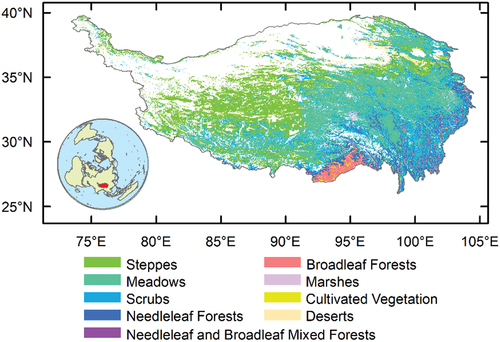
Figure 2. Framework of the study.
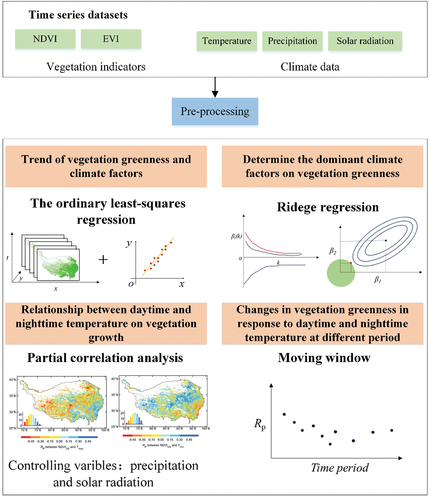
Figure 3. (a) Spatial distribution of trends in growing season NDVI (NDVIGS) and (b) temporal variation in NDVIGS on the Tibetan Plateau during 2000–2021.
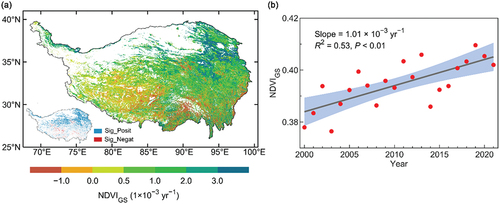
Figure 4. Spatial distribution of trends in growing season (a) mean maximum temperature (TmaxGS), (b) minimum temperature (TminGS), (c) cumulative precipitation (PreGS), and (d) cumulative solar radiation downward (SsrdGS) during 2000–2021. The inset was trend of TmaxGS, TminGS, PreGS and SsrdGS at p < 0.05 level.
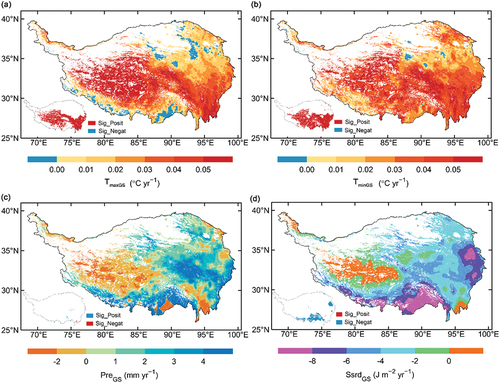
Figure 5. Spatial distribution of (a) and (b) partial correlation coefficient between growing season NDVI and maximum temperature (Tmax) and minimum temperature (Tmin), (c) and (d) sensitivity of growing season NDVI to Tmax and Tmin. variation in the proportion of pixels on partial correlation between growing season NDVI and (e) Tmax and (f) Tmin in different vegetation types (>5% of pixels). (g) variation (median: line; mean: solid circle) in changes in the partial correlation coefficient and (h) sensitivity between growing season NDVI and Tmax (the blue box) and Tmin (the orange box) in different vegetation types (>5% of pixels).
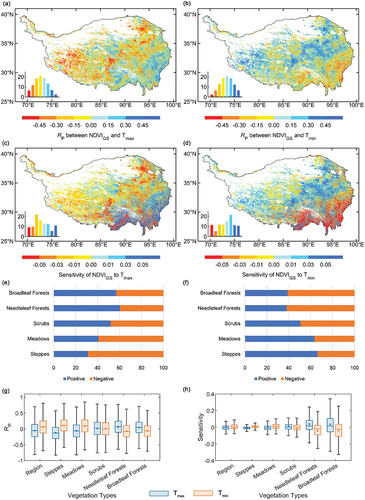
Figure 6. (a) Temporal variations in partial correlation coefficient between growing season NDVI and maximum temperature and (b) minimum temperature from 7-year–12-year moving window.
Figure 7. Spatial distribution of (a) multiyear mean of days of growing season mean minimum temperature (Tmin) < 0°C and (b) trends of days of Tmin < 0°C on the Tibetan Plateau during 2000–2021, (c) multiyear mean of days of Tmin < 0°C and (d) trends of days of Tmin < 0°C among different vegetation types (>5% of pixels).
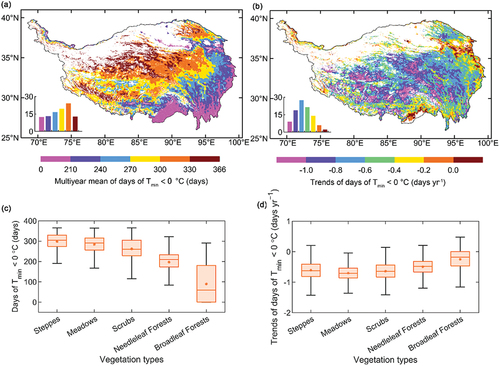
Figure 8. Variations of partial correlation coefficient (RP) between growing season NDVI and minimum temperature (Tmin) with minimum temperature in (a) grasslands (including steppes and meadows) and (b) forests (including needleleaf forests, broadleaf forests).
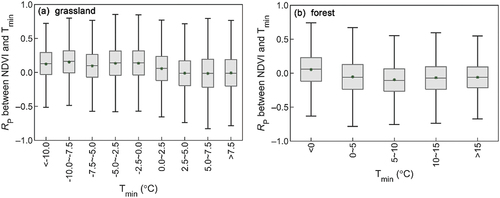
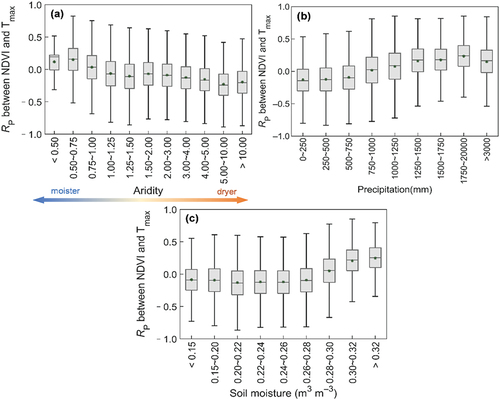
Figure 9. Variations of partial correlation coefficient between growing season NDVI and maximum temperature (Tmax) with (a) aridity, (b) multiyear mean of growing season precipitation during 2000–2021 and (c) multiyear mean of growing season soil moisture during 2001–2020 (due to data gaps in 2000 and 2021) on the Tibetan Plateau grasslands (including steppes and meadows).
20240422_Supplementary Figures.docx
Download MS Word (5.9 MB)Data availability statement
All the data used for this study are publicly available online. MOD13A1 NDVI and EVI, https://lpdaac.usgs.gov/products/mod13a1v061/; ERA5-Land dataset, https://cds.climate.copernicus.eu/; Elevation data, https://lpdaac.usgs.gov/products/srtmgl1v003/; vegetation types data, https://www.plantplus.cn/dsite/zhibei/b12.html.