
Figures & data
Figure 1. Average yields of (a) soybean and (b) maize in the Midwestern United States, 2004–2021.
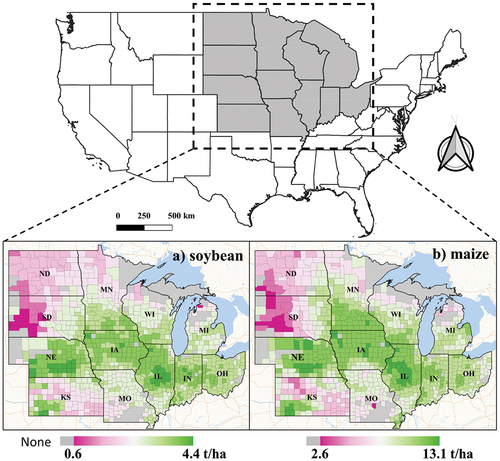
Figure 2. Historical yield records of a) soybean and b) maize in the Midwestern U.S., 2004–2021.
Table 1. Summary of bands from the satellite and climate datasets.
Figure 3. Flowchart of the soybean and maize yield prediction at the county level under the five detrending scenarios employing an XGBoost-based model.
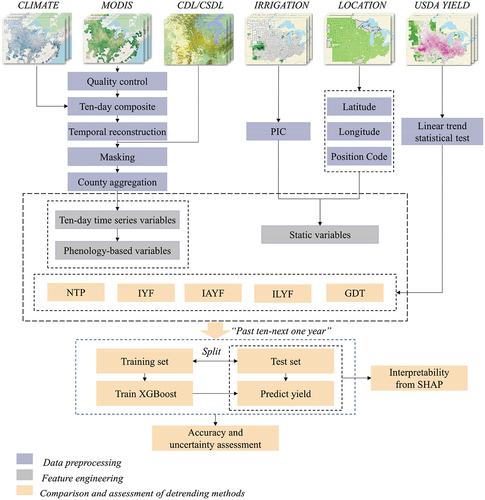
Table 2. Average prediction accuracy for the soybean and maize yield of five groups from 2014 to 2021.
Figure 4. Performance comparison of the yield prediction by the 5 detrending methods (NTP, IYF, IAYF, ILYF, and GDT) from 2014–2021. A) R2 of the soybean yield predictions, b) RMSE of the soybean yield predictions, c) R2 of the maize yield predictions, and d) RMSE of the maize yield predictions.
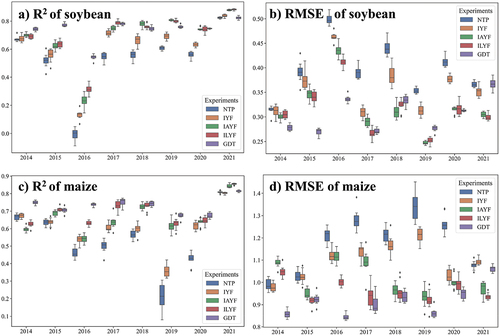
Table 3. Annual average predictions and statistical values for soybean yield.
Table 4. Annual average predictions and statistical values for maize yield.
Figure 5. Spatial distribution of the yield prediction errors (predicted value – statistical value) for soybean (2016) and maize (2019) using the 5 detrending methods (NTP, IYF, IAYF, ILYF, and GDT).
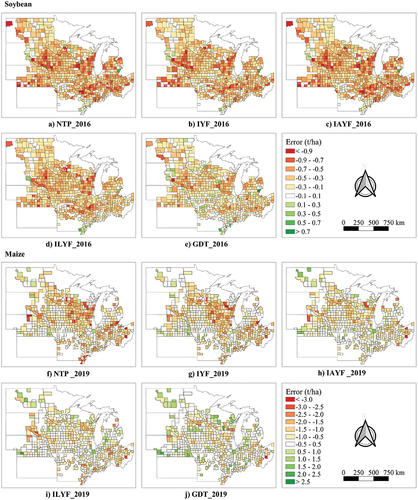
Figure 6. Spatial contrast of the predicted yields utilizing GDT against NASS statistical yields for soybean and maize in 2016 and 2019.
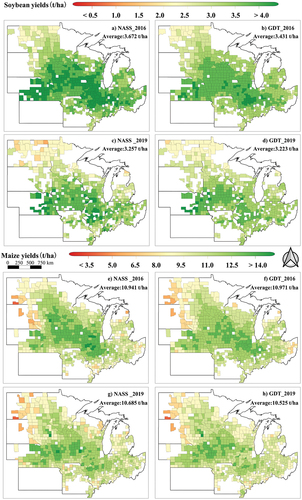
Figure 7. SHAP values of the soybean yield predictions for 2016, 2019, and 2021; the horizontal axis represents the SHAP values affecting the model output.
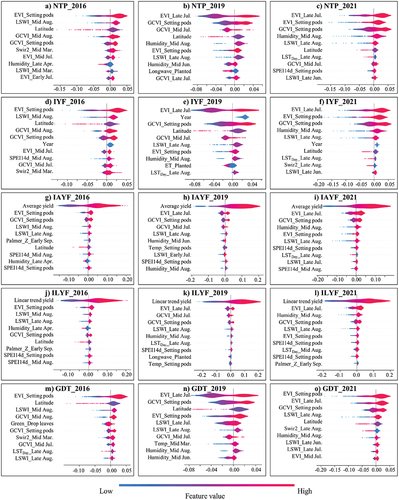
Figure 8. SHAP values of the maize yield predictions for 2016, 2019, and 2021; the horizontal axis represents the SHAP values affecting the model output.
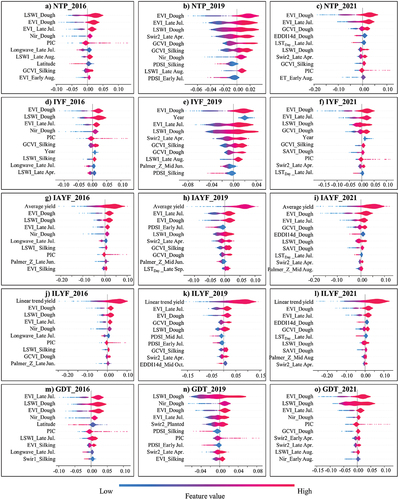
Figure 9. Relationship between the absolute error of soybean and maize after detrending with ILYF and GDT and the deviation from the trend yield.
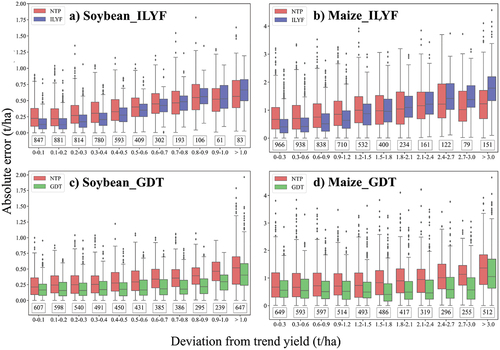
Figure 10. Percentage of drought with different magnitudes in the various phenological stages of soybean and maize in 2012 and 2016.
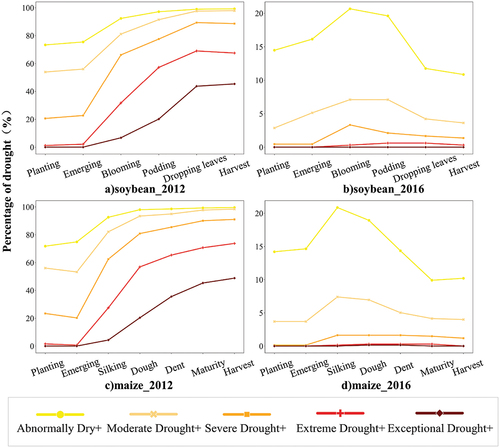
Figure 11. Scatterplot of the soybean and maize yield predictions in 2012 and 2016.
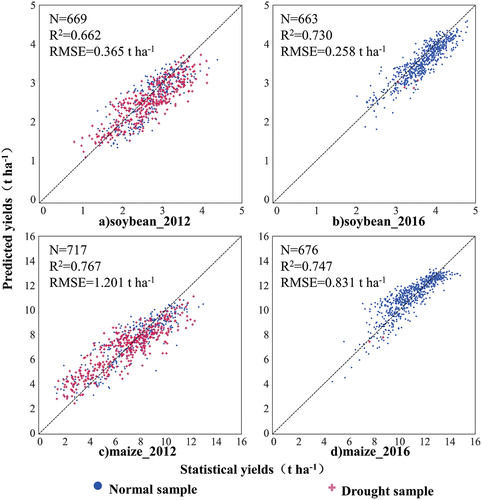
Figure 12. SHAP values for the soybean and maize yield predictions for 2012 and 2016.
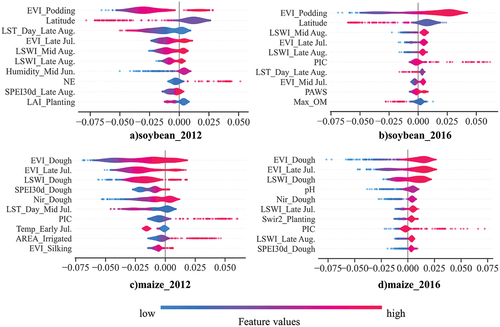
Figure 13. Interaction plot of the best features of the soybean and maize yield prediction for 2012 and 2016.
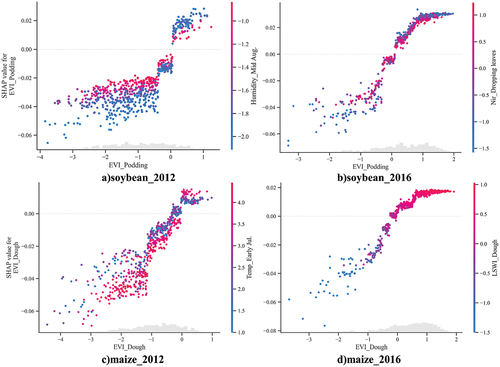
Table A1. Comparison of R2 of soybean yield prediction between XGBoost and other models.
Table A2. Comparison of RMSE (t ha−1) of soybean yield prediction between XGBoost and other models.
Table A3. Comparison of R2 of maize yield prediction between XGBoost and other models.
Table A4. Comparison of RMSE (t ha−1) of maize yield prediction between XGBoost and other models.
Data availability statement
The data that support the findings of this study are available from the corresponding author, Hongwei Zeng, upon reasonable request.