
Figures & data
Figure 1. Depletion of USP20 impairs the autophagy pathway. (A) The construction of a dual fluorescent RFP-GFP-LC3B enables the characterization of different stages of the autophagy pathway. Autophagosomes are represented in yellow (RFP+ GFP+), while autolysosomes appear in red (RFP+ GFP−) due to the quenching of GFP under acidic conditions in the lysosome. (B) HeLa cells stably expressing RFP-GFP-LC3B were transfected with either scramble shRNA or USP20 shRNA. After 72 h of transfection, cells were treated with EBSS or EBSS+BafA1 (100 nM) for 4 h. Scale bar: 10 μm. (C,D) The number of autophagosomes (GFP+ RFP+, yellow puncta) (C) or autolysosome (RFP+ GFP−, red puncta) (D) per cell from (B) was quantified. (E) the percentage of autophagosomes (yellow) and autolysosomes (red) in a cell under starvation conditions using EBSS medium from (B) was determined. (F) the size of autophagosomes (GFP+ RFP+, yellow puncta) in (B) was quantified. (G) USP20 knockout inhibits autophagy. U-2 OS wild-type and USP20 knockout cells were subjected to DMEM or EBSS treatment for 4 h prior to fixation. Subsequently, cells were immunostained with LC3B (red), and the nuclei were labeled with DAPI (blue). Scale bar: 10 μm. (H) The number of LC3B puncta per cell from (G) was quantified. (I) Immunoblotting was conducted to assess the knockdown efficiency of USP20 and to analyze the ratio of LC3B-II to ACTB under normal and starvation conditions. ACTB was used as a loading control. Statistical analyses were performed on data from three independent experiments, with counts of more than 100 cells. Error bars represent SEM. The significance levels are indicated as n.s., not significant, **p < 0.01, and ***p < 0.001 (one-way ANOVA with Tukey’s test).
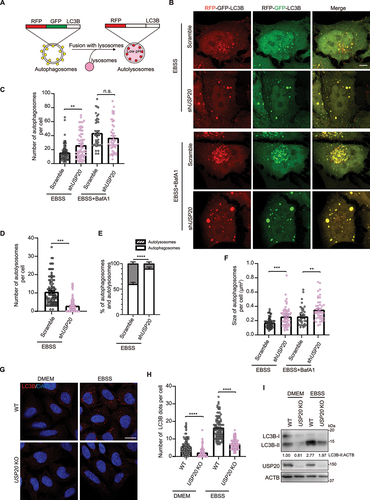
Figure 2. USP20 is involved in the process of reticulophagy. (A) U-2 OS cells were transfected with either the empty vector or FLAG-USP20, along with RFP-SEC61B. After 24 h of transfection, cells were fixed and immunostained with antibody against FLAG (green). Scale bar: 5 μm. (B) U-2 OS cells were transfected with scramble shRNA or USP20 shRNA, along with GFP-SEC61B. After 72 h of transfection, cells were lysed with RIPA buffer, and the lysates were subjected to immunoblotting using the indicated antibodies. ACTB was used as a loading control. (C) The relative fold changes of the ratio of GFP to GFP-SEC61B as shown in (B) are presented as means of three replicate experiments ± SEM. The significance levels are indicated as *p < 0.05 and **p < 0.01 (one-way ANOVA with Tukey’s test). (D) The dual fluorescent ssRFP-EGFP-KDEL was constructed by fusing the ER signal sequence with RFP-EGFP, followed by the ER retention signal KDEL. This construct enables the characterization of different stages of reticulophagy. ER fragments trapped in autophagosomes are represented in yellow (RFP+ GFP+), while those trapped in autolysosomes appear in red (RFP+ GFP−) due to the quenching of GFP under acidic conditions in the lysosome. (E) HeLa cells stably expressing Tet-on ssRFP-GFP-KDEL were transfected with either scramble shRNA or USP20 shRNA. After 48 h, doxycycline (DOX) was added to induce the expression of ssRFP-GFP-KDEL. After 24 h of induction, cells were treated with DMEM or EBSS for 9 h. Cells were then fixed for fluorescence detection. Scale bar: 5 μm. (F) The number of red (RFP+ GFP−) KDEL puncta per cell was quantified from (E). Statistical analyses were performed on data from three independent experiments, with counts of more than 100 cells. Error bars represent SEM. The significance levels are indicated as n.s., not significant, and ****p < 0.0001 (one-way ANOVA with Tukey’s test). (G) Samples from (E) were subject to immunoblotting with the indicated antibodies to assess the cleavage of ssRFP-GFP-KDEL, resulting in the generation of RFP. ACTB was used as a loading control. LE: long exposure; SE: short exposure.
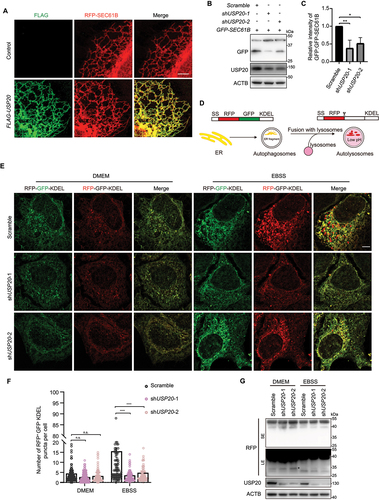
Figure 3. USP20 interacts with RETREG1 and mediates the deubiquitination of RETREG1. (A) HEK293FT cells were transfected with either the empty vector, MYC-USP20, or MYC-USP20C154S,H643Q, along with FLAG-RETREG1 and HA-UB. After 24 h of transfection, FLAG affinity isolation was performed under denaturing conditions using anti-FLAG magnetic beads, and the immunoprecipitated samples were subjected to immunoblotting analysis using the specific antibodies. The numbers indicate the relative amount of FLAG-RETREG1 signal compared to the control condition. (B) RETREG1 is deubiquitinated by USP20. HEK293FT cells were transfected with FLAG-RETREG1 and HA-UB. The cells were then treated with different concentration of USP20 inhibitor GSK2643943A for 12 h. FLAG affinity isolation was performed under denaturing conditions using anti-FLAG magnetic beads, followed by immunoblotting analysis using the indicated antibodies. (C) USP20 knockdown leads to the accumulation of RETREG1-conjugated ubiquitin signal. HeLa cells stably expressing FLAG-GFP-RETREG1 were established through lentivirus-mediated transfection. Subsequently, the cells were transfected with either scramble shRNA or USP20 shRNA, and FLAG affinity isolation was performed under denaturing conditions. The analysis was conducted by immunoblotting with the indicated antibody. (D) USP20 interacts with RETREG1 in cells. HEK293FT cells were transfected with either the empty vector or MYC-USP20, along with FLAG-RETREG1. MYC affinity isolation was performed using anti-MYC magnetic beads, and the samples were subjected to immunoblotting analysis using the specific antibodies. (E) The endogenous interaction between USP20 and RETREG1. Cell lysates from HEK293FT cells were subjected to immunoprecipitation using antibodies against RETREG1. The immunoprecipitated samples were then analyzed by immunoblotting to detect the presence of USP20. (F) USP20 cleaves both K48- and K63-linked ubiquitin chains from RETREG1. HEK293FT cells were transfected with either the empty vector or MYC-USP20, together with HA-UB or HA-UB[K48 only] or HA-UB[K63 only], along with FLAG-RETREG1. FLAG affinity isolation was performed under denaturing conditions using anti-FLAG magnetic beads, and the immunoprecipitated samples were subjected to immunoblotting analysis using the specific antibodies. (G and I) cycloheximide (CHX) chase analysis of FLAG-RETREG1 under control or USP20 overexpression conditions (G), or under scramble shRNA or USP20 shRNA knockdown conditions (I). HEK293FT cells were treated with CHX at a concentration of 100 μg/ml for 0, 4, or 8 h to block protein synthesis. The degradation rate of FLAG-RETREG1 was monitored over time by immunoblotting. (H and J) statistical analysis of the degradation rate of FLAG-RETREG1 in (G and I). Data are mean ± SEM from three independent experiments. (K) The degradation of FLAG-RETREG1 protein is dependent on the proteasome. HEK293FT cells expressing FLAG-RETREG1 were subjected to various treatments including control, MG132 (10 μM)or BafA1 (100 nM) for 12 h. Protein synthesis was blocked using CHX at a concentration of 100 μg/ml for 0, 6, or 12 h. The degradation kinetics of FLAG-RETREG1 were monitored over time using immunoblotting. ACTB was used as the loading control for all immunoblotting analyses. The numbers indicate the relative amount of FLAG-RETREG1 signal compared to the initial time point (0 h), normalized to ACTB.
![Figure 3. USP20 interacts with RETREG1 and mediates the deubiquitination of RETREG1. (A) HEK293FT cells were transfected with either the empty vector, MYC-USP20, or MYC-USP20C154S,H643Q, along with FLAG-RETREG1 and HA-UB. After 24 h of transfection, FLAG affinity isolation was performed under denaturing conditions using anti-FLAG magnetic beads, and the immunoprecipitated samples were subjected to immunoblotting analysis using the specific antibodies. The numbers indicate the relative amount of FLAG-RETREG1 signal compared to the control condition. (B) RETREG1 is deubiquitinated by USP20. HEK293FT cells were transfected with FLAG-RETREG1 and HA-UB. The cells were then treated with different concentration of USP20 inhibitor GSK2643943A for 12 h. FLAG affinity isolation was performed under denaturing conditions using anti-FLAG magnetic beads, followed by immunoblotting analysis using the indicated antibodies. (C) USP20 knockdown leads to the accumulation of RETREG1-conjugated ubiquitin signal. HeLa cells stably expressing FLAG-GFP-RETREG1 were established through lentivirus-mediated transfection. Subsequently, the cells were transfected with either scramble shRNA or USP20 shRNA, and FLAG affinity isolation was performed under denaturing conditions. The analysis was conducted by immunoblotting with the indicated antibody. (D) USP20 interacts with RETREG1 in cells. HEK293FT cells were transfected with either the empty vector or MYC-USP20, along with FLAG-RETREG1. MYC affinity isolation was performed using anti-MYC magnetic beads, and the samples were subjected to immunoblotting analysis using the specific antibodies. (E) The endogenous interaction between USP20 and RETREG1. Cell lysates from HEK293FT cells were subjected to immunoprecipitation using antibodies against RETREG1. The immunoprecipitated samples were then analyzed by immunoblotting to detect the presence of USP20. (F) USP20 cleaves both K48- and K63-linked ubiquitin chains from RETREG1. HEK293FT cells were transfected with either the empty vector or MYC-USP20, together with HA-UB or HA-UB[K48 only] or HA-UB[K63 only], along with FLAG-RETREG1. FLAG affinity isolation was performed under denaturing conditions using anti-FLAG magnetic beads, and the immunoprecipitated samples were subjected to immunoblotting analysis using the specific antibodies. (G and I) cycloheximide (CHX) chase analysis of FLAG-RETREG1 under control or USP20 overexpression conditions (G), or under scramble shRNA or USP20 shRNA knockdown conditions (I). HEK293FT cells were treated with CHX at a concentration of 100 μg/ml for 0, 4, or 8 h to block protein synthesis. The degradation rate of FLAG-RETREG1 was monitored over time by immunoblotting. (H and J) statistical analysis of the degradation rate of FLAG-RETREG1 in (G and I). Data are mean ± SEM from three independent experiments. (K) The degradation of FLAG-RETREG1 protein is dependent on the proteasome. HEK293FT cells expressing FLAG-RETREG1 were subjected to various treatments including control, MG132 (10 μM)or BafA1 (100 nM) for 12 h. Protein synthesis was blocked using CHX at a concentration of 100 μg/ml for 0, 6, or 12 h. The degradation kinetics of FLAG-RETREG1 were monitored over time using immunoblotting. ACTB was used as the loading control for all immunoblotting analyses. The numbers indicate the relative amount of FLAG-RETREG1 signal compared to the initial time point (0 h), normalized to ACTB.](/cms/asset/6eee70c5-60da-4d9d-900c-bb09df676092/kaup_a_2347103_f0003_oc.jpg)
Figure 4. USP20 promotes the interaction between RETREG1 and LC3B. (A) HeLa cells were transfected with either the empty vector or FLAG-USP20, along with GFP-RETREG1. Following transfection, the cells were treated with either DMEM or EBSS+BafA1 (100 nM) for 9 h before fixation. Subsequently, cells were immunostained with FLAG (cyan) and LC3B (red), and nuclei were labeled with DAPI (blue). Scale bar: 10 μm. Insets indicate the enlarged area. Scale bar: 2 μm. (B) The number of colocalized LC3B with RETREG1 per cell was quantified. Statistical analyses were performed on data from three independent experiments, with counts of more than 100 cells. Error bars represent SEM. The significance levels are indicated as *p < 0.05 and **p < 0.01 (one-way ANOVA with Tukey’s test). (C) RETREG1 exhibits increased interaction with LC3B upon overexpression of USP20, but not with USP20C154S,H643Q. HEK293FT cells were co-transfected with either the control vector or FLAG-RETREG1, along with the vector, MYC-USP20 or USP20C154S,H643Q. FLAG affinity isolation was performed using anti-FLAG magnetic beads, and the samples were immunoblotted with the indicated antibody. ACTB was used as a loading control. The numbers indicate the ratio of LC3B-II to FLAG. (D) Increased colocalization of USP20 with RETREG1 during starvation. HeLa cells were transfected with FLAG-USP20 and GFP-RETREG1. After transfection, the cells were treated with either DMEM or EBSS for 9 h before fixation. Immunostaining was performed using antibodies against FLAG (red). Z-stack projection of representative images showing the signals of FLAG-USP20 and GFP-RETREG1 was acquired by SIM. Scale bar: 10 μm. Insets indicate magnified orthogonal sectioning views of regions within the boxes. Scale bar: 2 μm. The areas within box I and II are rendered in 3D and displayed from different angles. Scale bar: 0.5 μm.
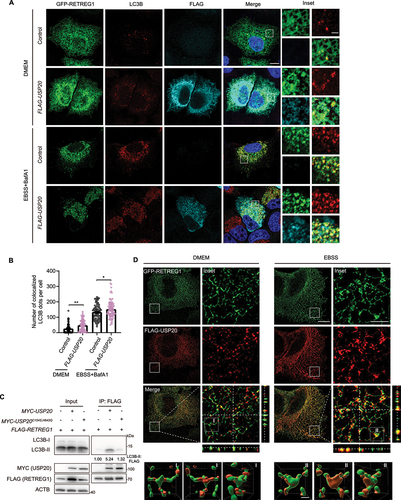
Figure 5. VAPs mediate the localization of USP20 to the ER. (A) The protein sequence of USP20 contains multiple domains, including a zinc finger (ZF) domain, a catalytic USP domain, and two DUSP domains. Two FFAT motifs, located in the USP domain, are conserved among different organisms. Multiple sequence alignment of USP20 proteins from various species was performed using the clustal omega in the European Bioinformatics Institute (EMBL-EBI) (https://www.ebi.ac.uk/Tools/msa/clustalo/). Conserved regions are shaded in grey. (B) The construction of USP20-FLAG-GFP knock-in cell line enables the characterization of endogenous USP20 level. The FLAG-GFP fragment was inserted into the C terminus of USP20 via CRISPR-Cas9-mediated knock-in. (C) Endogenous USP20 colocalized with VAPB. The USP20-FLAG-GFP knock-in cells were fixed and immunostained with antibody against VAPB (red). Scale bar: 10 μm. (D) The FFAT motifs of USP20 are responsible for its interaction with VAPA and VAPB. HEK293FT were transfected with FLAG-USP20 wild-type or its mutants, including FLAG-USP20[ΔFFAT1], FLAG-USP20[ΔFFAT2] or FLAG-USP20[ΔFFAT1/2]. Subsequently, FLAG affinity isolation was performed using anti-FLAG magnetic beads, and the samples were analyzed by immunoblotting with the indicated antibodies. ACTB was used as a loading control. (E) Deleting the FFAT motifs of USP20 results in reduced enrichment in the ER. HEK293FT cells were transfected with either FLAG-USP20 or FLAG-USP20[ΔFFAT1/2]. A microsome fractionation assay was performed to illustrate the localization of USP20 in the ER. The ER marker VAPB was used to indicate the ER fraction, while ACTB was used to indicate the cytosol fraction. (F) FLAG-USP20[ΔFFAT1/2] does not localize to the ER. HeLa cells were transfected with either FLAG-USP20 or FLAG-USP20[ΔFFAT1/2]. After 24 h of transfection, the cells were fixed and immunostained with anti-FLAG antibody (green), and the nuclei were labeled with DAPI (blue). Scale bar: 10 μm. (G) VAPA and VAPB exhibit reduced interaction with USP20 when their FFAT-binding motifs are mutated. HeLa cells were transfected with GFP-VAPA, GFP-VAPAK94,M96D, GFP-VAPB or GFP-VAPBK87D,M89D. After 24 h of transfection, a GFP immunoprecipitation assay was performed, and the samples were analyzed by immunoblotting using the specific antibodies. ACTB was used as a loading control. (H) USP20 exhibits reduced localization to the ER in VAPA and VAPB double-knockout (DKO) cells. A microsome fractionation assay was performed using both HEK293FT wild-type cells and VAPA and VAPB double-knockout cells to evaluate the enrichment of USP20 in the ER. The effectiveness of VAPA and VAPB knockout was confirmed by immunoblotting with VAPA and VAPB antibodies, while ACTB was used as a marker for the cytosol fraction. (I) Localization of USP20 and VAPB on the ER. HeLa cells were transfected with FLAG-USP20. Following transfection, the cells were subjected to DMEM or EBSS treatment for 9 h prior to fixation. Subsequently, cells were immunostained with FLAG (red) and VAPB (green). Z-stack projection of representative images showing the signals of FLAG-USP20 and VAPB was acquired by SIM. Scale bar: 10 μm. Insets indicate magnified orthogonal sectioning views of regions within the boxes. Scale bar: 1 μm.
![Figure 5. VAPs mediate the localization of USP20 to the ER. (A) The protein sequence of USP20 contains multiple domains, including a zinc finger (ZF) domain, a catalytic USP domain, and two DUSP domains. Two FFAT motifs, located in the USP domain, are conserved among different organisms. Multiple sequence alignment of USP20 proteins from various species was performed using the clustal omega in the European Bioinformatics Institute (EMBL-EBI) (https://www.ebi.ac.uk/Tools/msa/clustalo/). Conserved regions are shaded in grey. (B) The construction of USP20-FLAG-GFP knock-in cell line enables the characterization of endogenous USP20 level. The FLAG-GFP fragment was inserted into the C terminus of USP20 via CRISPR-Cas9-mediated knock-in. (C) Endogenous USP20 colocalized with VAPB. The USP20-FLAG-GFP knock-in cells were fixed and immunostained with antibody against VAPB (red). Scale bar: 10 μm. (D) The FFAT motifs of USP20 are responsible for its interaction with VAPA and VAPB. HEK293FT were transfected with FLAG-USP20 wild-type or its mutants, including FLAG-USP20[ΔFFAT1], FLAG-USP20[ΔFFAT2] or FLAG-USP20[ΔFFAT1/2]. Subsequently, FLAG affinity isolation was performed using anti-FLAG magnetic beads, and the samples were analyzed by immunoblotting with the indicated antibodies. ACTB was used as a loading control. (E) Deleting the FFAT motifs of USP20 results in reduced enrichment in the ER. HEK293FT cells were transfected with either FLAG-USP20 or FLAG-USP20[ΔFFAT1/2]. A microsome fractionation assay was performed to illustrate the localization of USP20 in the ER. The ER marker VAPB was used to indicate the ER fraction, while ACTB was used to indicate the cytosol fraction. (F) FLAG-USP20[ΔFFAT1/2] does not localize to the ER. HeLa cells were transfected with either FLAG-USP20 or FLAG-USP20[ΔFFAT1/2]. After 24 h of transfection, the cells were fixed and immunostained with anti-FLAG antibody (green), and the nuclei were labeled with DAPI (blue). Scale bar: 10 μm. (G) VAPA and VAPB exhibit reduced interaction with USP20 when their FFAT-binding motifs are mutated. HeLa cells were transfected with GFP-VAPA, GFP-VAPAK94,M96D, GFP-VAPB or GFP-VAPBK87D,M89D. After 24 h of transfection, a GFP immunoprecipitation assay was performed, and the samples were analyzed by immunoblotting using the specific antibodies. ACTB was used as a loading control. (H) USP20 exhibits reduced localization to the ER in VAPA and VAPB double-knockout (DKO) cells. A microsome fractionation assay was performed using both HEK293FT wild-type cells and VAPA and VAPB double-knockout cells to evaluate the enrichment of USP20 in the ER. The effectiveness of VAPA and VAPB knockout was confirmed by immunoblotting with VAPA and VAPB antibodies, while ACTB was used as a marker for the cytosol fraction. (I) Localization of USP20 and VAPB on the ER. HeLa cells were transfected with FLAG-USP20. Following transfection, the cells were subjected to DMEM or EBSS treatment for 9 h prior to fixation. Subsequently, cells were immunostained with FLAG (red) and VAPB (green). Z-stack projection of representative images showing the signals of FLAG-USP20 and VAPB was acquired by SIM. Scale bar: 10 μm. Insets indicate magnified orthogonal sectioning views of regions within the boxes. Scale bar: 1 μm.](/cms/asset/1464324e-6104-4d0a-a3b2-2338a52bafb5/kaup_a_2347103_f0005_oc.jpg)
Figure 6. USP20 enhances the interaction between RETREG1 and VAPB on the ER. (A) Localization of RETREG1 and VAPB on the ER. HeLa cells were transfected with GFP-RETREG1. Following transfection, the cells were subjected to DMEM or EBSS treatment for 9 h prior to fixation. Subsequently, cells were immunostained with VAPB (red). Z-stack projection of representative images showing the signals of GFP-RETREG1 and VAPB was acquired by SIM. Scale bar: 10 μm. Insets indicate magnified orthogonal sectioning views of regions within the boxes. Scale bar: 2 μm. (B) USP20 promotes the interaction of RETREG1 with VAPB. HEK293FT cells were co-transfected with either the empty vector or MYC-USP20, along with the empty vector or FLAG-RETREG1. FLAG affinity isolation was performed using anti-FLAG magnetic beads, and the immunoprecipitated samples were subjected to immunoblotting analysis using the specific antibodies. ACTB was used as a loading control. (C) The USP20 FFAT1/2-deleted mutant does not enhance the interaction between RETREG1 and VAPB. HEK293FT cells were co-transfected with either the empty vector or MYC-USP20 or MYC-USP20[ΔFFAT1/2], along with FLAG-RETREG1. FLAG affinity isolation was performed using anti-FLAG magnetic beads, and the immunoprecipitated samples were subjected to immunoblotting analysis using the specific antibodies. ACTB was used as a loading control. (D) Overexpression of USP20 leads to an increase in the colocalization of WIPI2 with RETREG1 under both normal and starvation conditions. HeLa cells were transfected with the control vector or FLAG-USP20, along with GFP-RETREG1. Following transfection, the cells were subjected to DMEM or EBSS treatment for 9 h prior to fixation. Subsequently, cells were immunostained with WIPI2 (red) and FLAG (cyan). Scale bar: 10 μm. Insets indicate the enlarged area. Scale bar: 2 μm. (E and F) the number of WIPI2 dots per cell (E) and the percentage of RETREG1-colocalized WIPI2 (F) from (D) was quantified.
![Figure 6. USP20 enhances the interaction between RETREG1 and VAPB on the ER. (A) Localization of RETREG1 and VAPB on the ER. HeLa cells were transfected with GFP-RETREG1. Following transfection, the cells were subjected to DMEM or EBSS treatment for 9 h prior to fixation. Subsequently, cells were immunostained with VAPB (red). Z-stack projection of representative images showing the signals of GFP-RETREG1 and VAPB was acquired by SIM. Scale bar: 10 μm. Insets indicate magnified orthogonal sectioning views of regions within the boxes. Scale bar: 2 μm. (B) USP20 promotes the interaction of RETREG1 with VAPB. HEK293FT cells were co-transfected with either the empty vector or MYC-USP20, along with the empty vector or FLAG-RETREG1. FLAG affinity isolation was performed using anti-FLAG magnetic beads, and the immunoprecipitated samples were subjected to immunoblotting analysis using the specific antibodies. ACTB was used as a loading control. (C) The USP20 FFAT1/2-deleted mutant does not enhance the interaction between RETREG1 and VAPB. HEK293FT cells were co-transfected with either the empty vector or MYC-USP20 or MYC-USP20[ΔFFAT1/2], along with FLAG-RETREG1. FLAG affinity isolation was performed using anti-FLAG magnetic beads, and the immunoprecipitated samples were subjected to immunoblotting analysis using the specific antibodies. ACTB was used as a loading control. (D) Overexpression of USP20 leads to an increase in the colocalization of WIPI2 with RETREG1 under both normal and starvation conditions. HeLa cells were transfected with the control vector or FLAG-USP20, along with GFP-RETREG1. Following transfection, the cells were subjected to DMEM or EBSS treatment for 9 h prior to fixation. Subsequently, cells were immunostained with WIPI2 (red) and FLAG (cyan). Scale bar: 10 μm. Insets indicate the enlarged area. Scale bar: 2 μm. (E and F) the number of WIPI2 dots per cell (E) and the percentage of RETREG1-colocalized WIPI2 (F) from (D) was quantified.](/cms/asset/3e5d4c32-34aa-44a1-9db0-906eecd42954/kaup_a_2347103_f0006_oc.jpg)
Figure 7. The inhibition of reticulophagy caused by USP20 knockdown can be rescued by the expression of RETREG1 or wild-type USP20, but not by the USP20 mutants. (A) The expression of RETREG1 or wild-type USP20, but not the catalytically inactive mutant USP20C154S,H643Q or FFAT1/2-deleted mutant USP20[ΔFFAT1/2], fully rescued reticulophagy function. HeLa cells stably expressing Tet-on ssRFP-GFP-KDEL were transfected with either scramble shRNA or USP20 shRNA, together with the control, FLAG-RETREG1, FLAG-USP20, FLAG-USP20C154S,H643Q or FLAG-USP20[ΔFFAT1/2], respectively. After 48 h, DOX was added to induce the expression of ssRFP-GFP-KDEL. Following 24 h of induction, cells were treated with EBSS for 9 h, and then fixed for fluorescence detection. Scale bar: 5 μm. (B) The number of red (RFP+ GFP−) KDEL puncta per cell was quantified from (A). Statistical analyses were performed on data from three independent experiments, with counts of more than 100 cells. Error bars represent SEM. The significance levels are indicated as n.s., not significant, and ****p < 0.0001 (one-way ANOVA with Tukey’s test). (C) A proposed model elucidating the role of USP20 in regulating RETREG1 deubiquitination and facilitating reticulophagy. USP20 deubiquitinates and stabilizes RETREG1, while also being recruited to the ER by VAPs. Under starvation conditions, USP20 and RETREG1 form puncta, and USP20 further recruits VAPs to these loci. This concerted action leads to the recruitment of early autophagy proteins, including WIPI2, thereby promoting reticulophagy.
![Figure 7. The inhibition of reticulophagy caused by USP20 knockdown can be rescued by the expression of RETREG1 or wild-type USP20, but not by the USP20 mutants. (A) The expression of RETREG1 or wild-type USP20, but not the catalytically inactive mutant USP20C154S,H643Q or FFAT1/2-deleted mutant USP20[ΔFFAT1/2], fully rescued reticulophagy function. HeLa cells stably expressing Tet-on ssRFP-GFP-KDEL were transfected with either scramble shRNA or USP20 shRNA, together with the control, FLAG-RETREG1, FLAG-USP20, FLAG-USP20C154S,H643Q or FLAG-USP20[ΔFFAT1/2], respectively. After 48 h, DOX was added to induce the expression of ssRFP-GFP-KDEL. Following 24 h of induction, cells were treated with EBSS for 9 h, and then fixed for fluorescence detection. Scale bar: 5 μm. (B) The number of red (RFP+ GFP−) KDEL puncta per cell was quantified from (A). Statistical analyses were performed on data from three independent experiments, with counts of more than 100 cells. Error bars represent SEM. The significance levels are indicated as n.s., not significant, and ****p < 0.0001 (one-way ANOVA with Tukey’s test). (C) A proposed model elucidating the role of USP20 in regulating RETREG1 deubiquitination and facilitating reticulophagy. USP20 deubiquitinates and stabilizes RETREG1, while also being recruited to the ER by VAPs. Under starvation conditions, USP20 and RETREG1 form puncta, and USP20 further recruits VAPs to these loci. This concerted action leads to the recruitment of early autophagy proteins, including WIPI2, thereby promoting reticulophagy.](/cms/asset/986afccf-052e-4bc1-875a-b4c8652bd7c1/kaup_a_2347103_f0007_oc.jpg)