Figures & data
Figure 1. A/B: Patellar tendon CSA from pre to post in SCP (A) and PLA (B) group along entire tendon length from 0% (proximal) to 100% (distal). C: Percent change in patellar tendon CSA at 60% and 70% of tendon length. All data are mean and SEM. * indicates significant effects of time within group. # indicates significant time*group interaction effects.
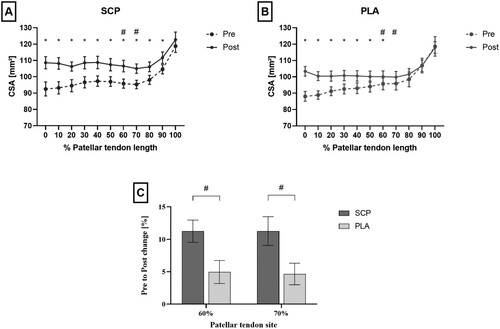
Table 1. ANOVA time*group interaction values for all patellar tendon sites.
Figure 2. Patellar tendon stiffness from pre to post of SCP and PLA group. Data shows mean with individual pre to post values. * indicates significant within-group differences between pre and post (p < 0.01).
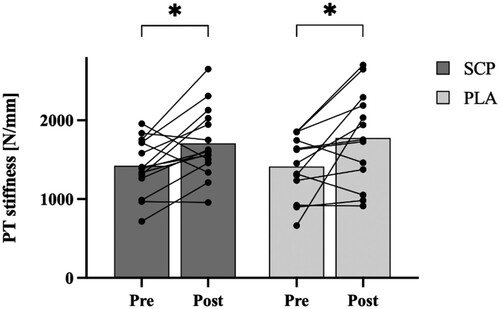
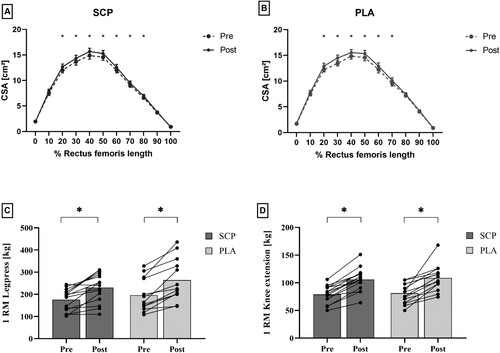
Figure 3. A/B: Rectus femoris CSA from pre to post in SCP (A) and PLA (B) group along entire muscle length from 0% (proximal) to 100% (distal) shown in mean and SEM. C/D: Pre to post analysis of 1RM measurement of SCP and PLA group for leg press (C) and knee extension (D) presented as mean with individual pre to post values. * indicates significant within-group differences between pre and post.