Figures & data
Figure 1. Poverty headcount ratio at national poverty lines (% of population) in the countries of the Mekong region. The World Bank, World development indicators used for this figure (https://databank.worldbank.org/) include only one entry for the Lao PDR in 2018. Two other datapoints were added based on the national population census data, found in Epprecht et al. (Citation2018).
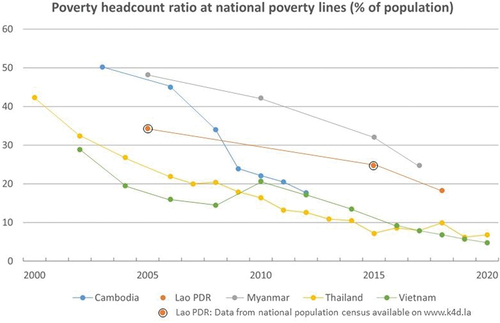
Figure 2. Changes of poverty rates between 2005 and 2015 and land-based investments in agricultural commodities and tree plantations in the Lao PDR (Nanhthavong et al., Citation2021).
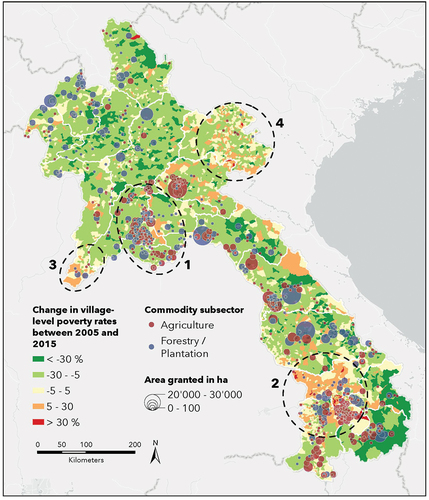
Figure 3. Changes in poverty incidence from 2005 to Citation2015 in 109 villages on the Bolaven Plateau in southern Laos. Data source: Lao statistics Bureau.
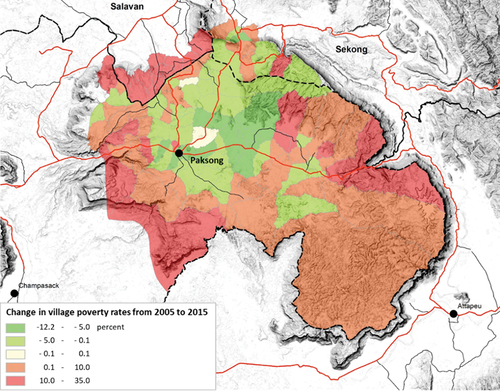
Figure 4. Loss of primary forest in the countries of the Mekong region (2001–2017). Sources: Global land analysis and discovery lab (GLAD): https://glad.umd.edu/dataset/mekong.
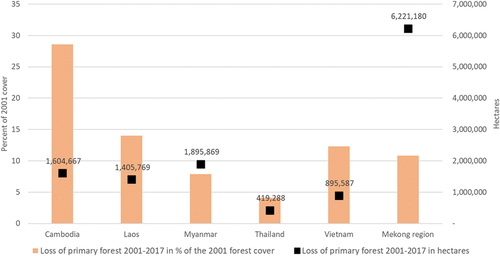
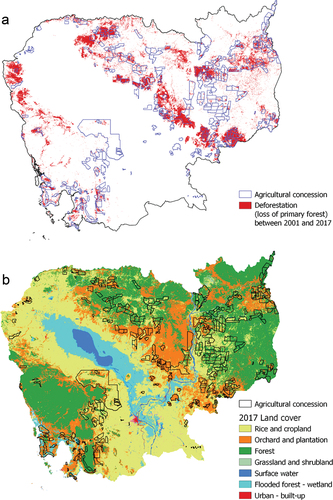
Figure 5. Deforestation (loss of primary forest) in Cambodia between 2001–2017. Sources: (1) land use 2017: SERVIR www.landcovermapping.org/en/landcover (2) deforestation: Potapov et al. (Citation2019). (3) agro-industrial concessions (as of 2012): www.Licadho-cambodia.Org/ Mapping and data computation by the authors.