
Figures & data
Figure 1. Map showing the location of lakes Big Momella and Rishateni, and the area (defined by the black line), within which the land use/land cover (LULC) changes from the year 1989 to 2019 were analyzed. Socio-economic activities were assessed in Miririny village, between February and March 2021, on the eastern side of Momella lakes, Tanzania.
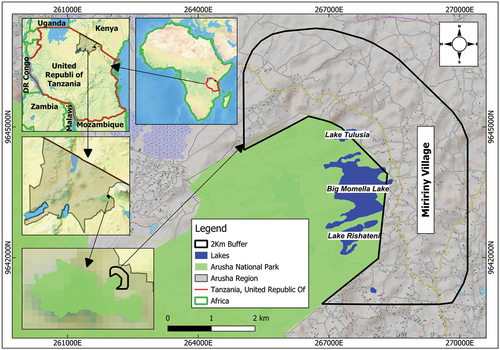
Table 1. Description of LULC classes used in our analyses on land-cover change from the year 1989 to 2019 on the Eastern side of the Momella lakes, Tanzania, based on the classification scheme provided in the IPCC’s Good Practice Guidance for Land Use Classification, also adopted by the Tanzania land use planning commission (IPCC, Citation2006; Twisa & Buchroithner, Citation2019).
Table 2. Type of information collected during the socio-economic survey on the eastern side of Momella lakes, Tanzania, during the study period between February and March 2021 (for the detailed questionnaire see Supplementary File 1).
Figure 2. The spatial pattern of LULC changes during the study period of the years 1989–2019 at the eastern side of the Momella lakes, northern Tanzania. Land cover categories were based on the classification scheme provided in the IPCC’s Good Practice Guidance for Land Use Classification, also adopted by the Tanzania Land Use Planning Commission (IPCC, Citation2006; Twisa & Buchroithner, Citation2019). The area statistics of each land use type based on the classified images of the study area are provided (see Appendix B: ).
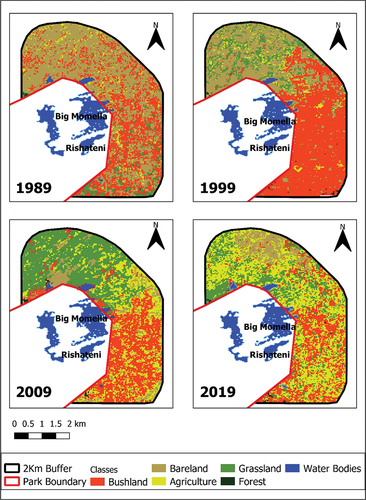
Figure 3. Map showing (a) the location of the households surveyed (b) farm size owned (c) number of livestock owned and (d) the use of fertilizers by each household in Miririny village as based on our interview outcomes, between February and March 2021, on the eastern side of the Momella lakes, Tanzania.
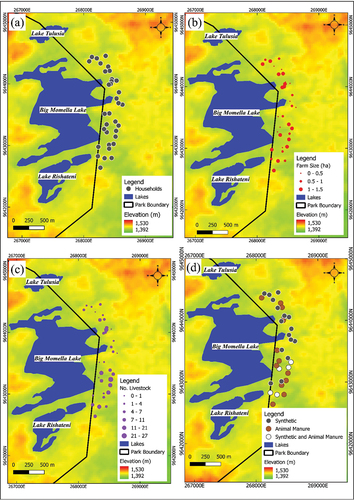
Table 3. The number (frequency of respondents) and percentage of farmers growing certain crops as stated by our interviewees in the study area around Arusha National Park, in Miririny village, northern Tanzania, during our survey from February to March 2021 (Frequency = number of respondents, N = 35). Multiple answers were possible.
Figure 4. Plot showing monthly average rainfall (mm) and percentage of interviewed local people (%) applying animal manure (natural fertilizer) and chemical fertilizer between May 2020 and April 2021 in the community bordering the Momella lakes, northern Tanzania.
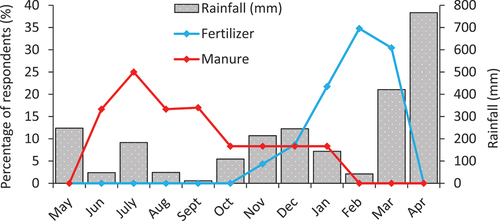
Figure 5. Plot showing monthly lesser flamingo trends (Source: Author) and percentage of interviewed local people (%) applying animal manure (natural fertilizer) and chemical fertilizer between May 2020 and April 2021 in the community bordering the Momella lakes, northern Tanzania.
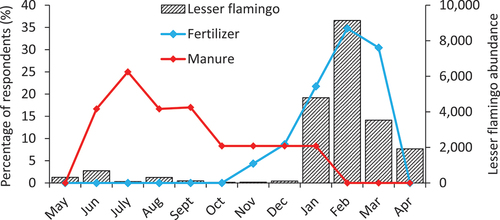
Figure A1. Farms and settlements of the local communities residing on the eastern side of Lake Big Momella, Tanzania (September 2021).
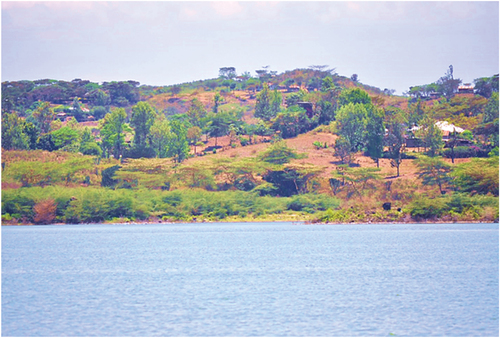
Figure A2. One of the residents captured grazing their livestock on the eastern side of Lake Big Momella shoreline, Tanzania (January 2021).
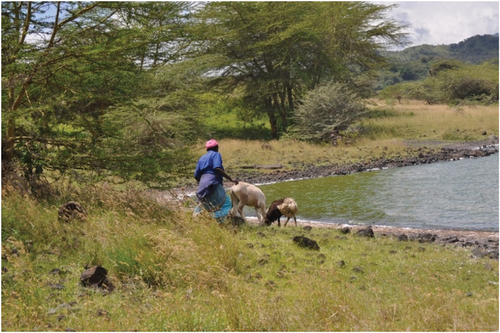
Figure A3. Past, current and projected human population size trend in the Meru District, Tanzania, as projected to 2032 (URT, Citation2013; URT, Citation2022).
Table B1. Area of the different land cover classes (in ha and %) over the years 1989 to 2019 and the annual rate of change (in %/year and ha/year) on the eastern side of the Momella lakes, northern Tanzania.
Table B2. Cross-tabulation of LULC classes between 1989 and 1999 in (ha).
Table B3. Cross-tabulation of LULC classes between 1999 and 2009 in (ha).
Table B4. Cross-tabulation of LULC classes between 2009 and 2019 in (ha).
Figure B1. Average annual rainfall pattern over the past three decades for the Arusha National Park, northern Tanzania, based on rainfall records and rainfall datasets extracted from the Center for Hydrometeorology and Remote Sensing (Nguyen et al., Citation2019). The red bars show the years on which remote sensing images were used.
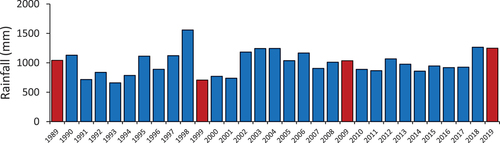
Table C1. Livestock numbers kept by local communities in the study area in Miririny village, northern Tanzania during our survey from February to March 2021. Livestock was kept mainly under free grazing practices. (Number of respondents, N = 31).
Table C2. Common types of fertilizers (frequency and percentages of application) used by local communities in Miririny village, northern Tanzania, supplied by agro-dealers and agrochemical shops revealed by the farmers who applied fertilizers in the study area (Number of respondents, N = 23).