
Figures & data
Table 1. Extreme climate envelope (Domingos and Rato Citation2019).
Figure 1. Cold (Dfb), Tropical (Aw, As) and Arid (BWh) climates (1980–2016). Present and future Köppen-Geiger climate classification maps at 1-km resolution (Beck et al. Citation2020).
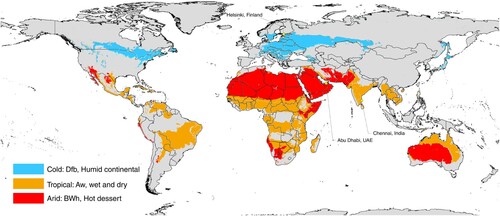
Table 2. Cities Climate condition.
Figure 2. Layout and 3D model used for simulation.
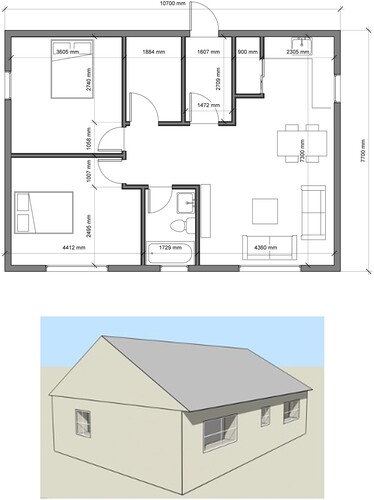
Table 3. Basic model envelope’s U-Value.
Table 4. Cities site parameters (EnergyPlus and World Meteorological Organization Citation2022).
Table 5. Strategies and coding.
Figure 3. 3D model with shading options in DB.
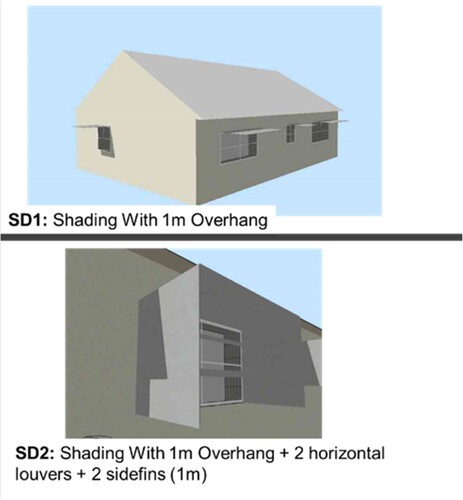
Figure 4. Comfort zone annually (8760 h) by ASHRAE 55 Methodology – Cities. Climate consultant.
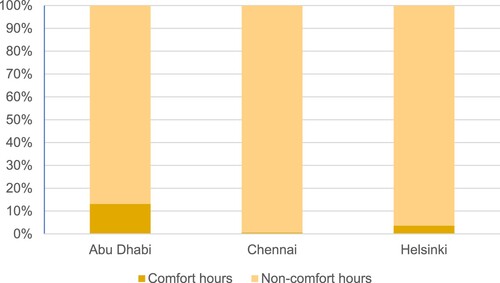
Figure 5. Strategies per city.
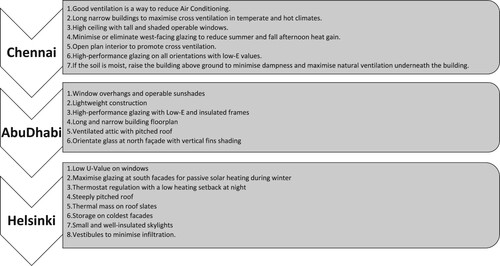
Figure 6. Energy consumption distribution.
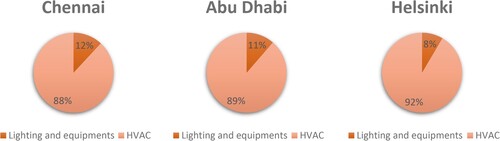
Figure 7. Effectiveness of operable energy decrease per strategies in different climates based on ().
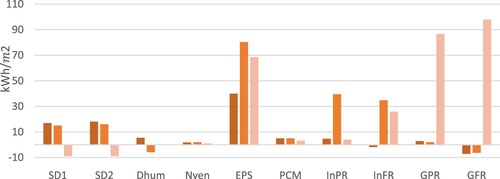
Figure 8. Comparison between the base model () and most effective design strategies (
).
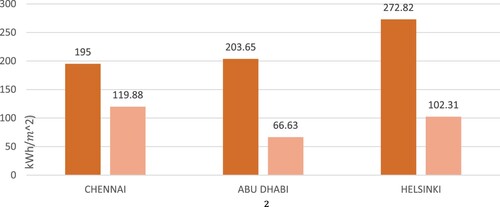
Table 6. Energy per total building area improvement from base model (kWh/).
Table 7. Design Strategies’ Effectiveness in Chennai.
Figure 9. Base model vs EPS + PCM for Chennai.
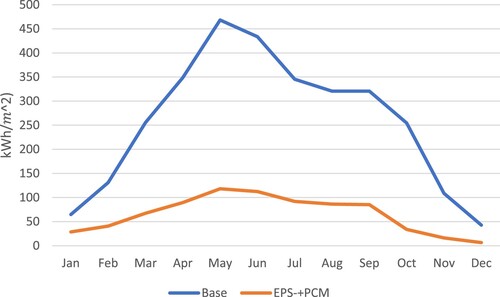
Table 8. Abu Dhabi’s design strategies’ effectiveness.
Table 9. Comparison between base fabrics wall and EPS + PCM wall (kWh).
Figure 10. Daylight comparison in three cities, from top to bottom: Chennai, Abu Dhabi and Helsinki.
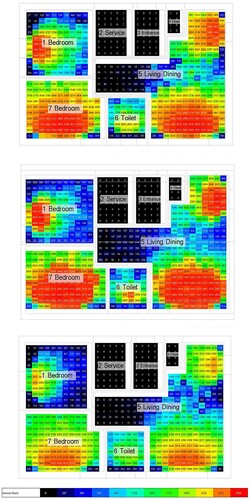
Table 10. Helsinki’s design strategies.
Table 11. Helsinki´s Comparison between base roof and GFR (kWh).
Data availability statement
The data that support the findings of this study are available from the corresponding author upon reasonable request.