
Figures & data
Figure 1. Distribution of RBCs in China, main resource types, and the Plan’s classification.
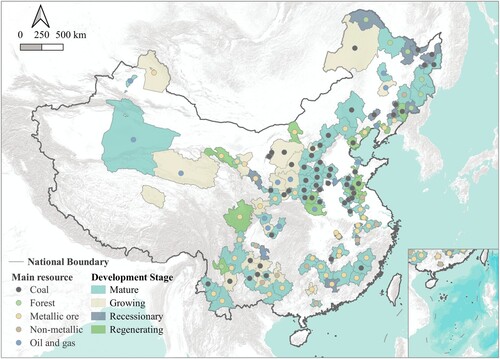
Figure. 2. Implementation Process of AAI-PLR.
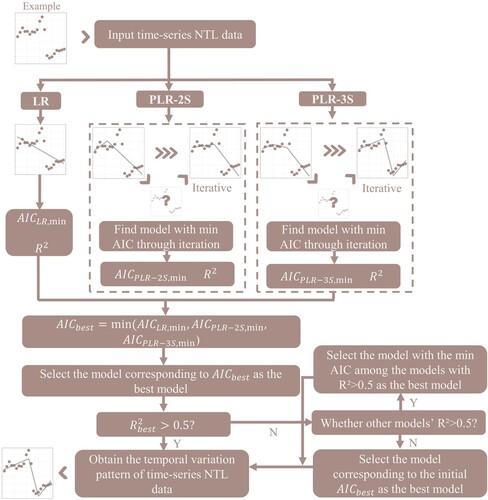
Figure 3. Results of AAI-PLR Fitting. (a) Distribution pie chart of R2 values. (b) The proportions of the three models. (c) Pie chart of NTL change process classification. (d-h) Visualization of five types of NTL change processes and their averages, with (d) ‘+-+’, (e) ‘0++’, (f) ‘+–’, (g) ‘0+’, and (h) ‘-++’.
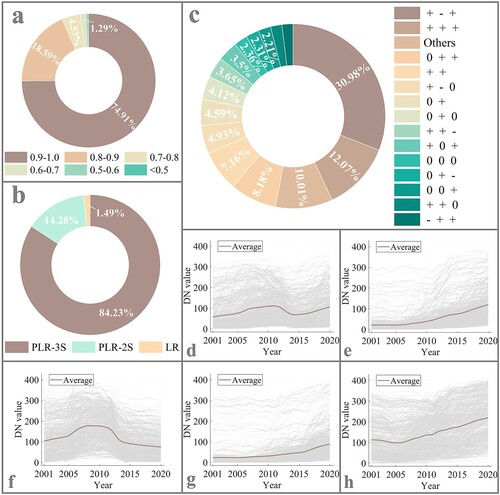
Table 1. Classification principles of NTL change processes at pixel scale.
Figure 4. Distribution of RBCs proportions for different types under two city classification systems. (a) Categories of RBCs based on main resources. (b) Categories of RBCs by the Plan.
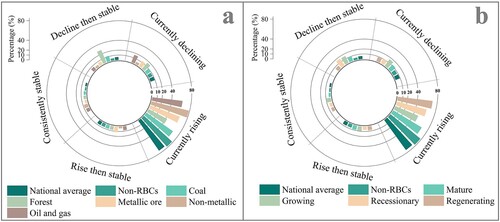
Figure 5. Annual variation in the proportion of PTN and NTN. (a) Categories of RBCs based on main resources. (b) Categories of RBCs by the Plan.
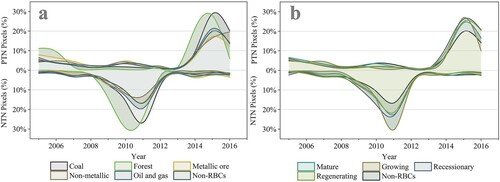
Figure 6. Geospatial distribution of NTL classification proportions in different cities, LISA mapping and comparison with the national average. (a) Currently declining. (b) Decline then stable. (c) Consistently stable. (d) Rise then stable. (e) Currently rising.
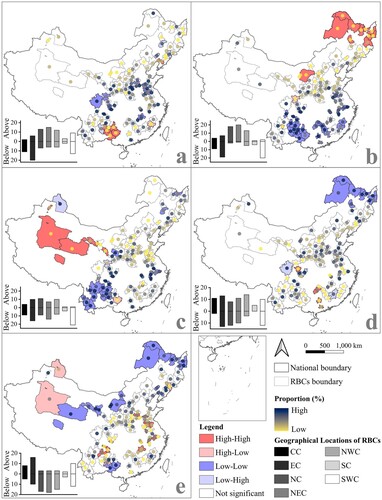
Figure 7. Number statistics and geographical distribution of RBCs in different stages of development. (a) The proportions of different pixel areas under the new classification system. (b) Comparison of the number of RBCs in different stages of development with non-RBCs. (c) Distribution of RBCs in different stages of city development.
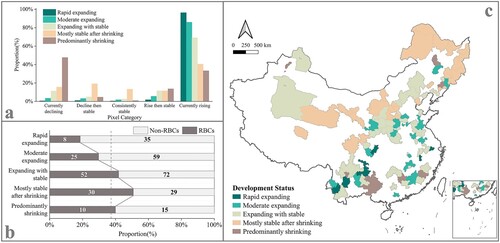
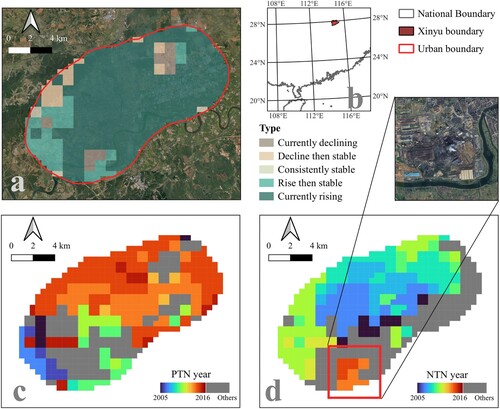
Figure 8. Visualizing the urban development process of Xinyu. (a) Spatial distribution of different NTL categories in Xinyu. (b) The location of Xinyu in China. (c) The time and location of PTN. (d) The time and location of NTN.
Data availability statement
The data that support the findings of this study are available from the corresponding author(s) upon reasonable request.