Figures & data
Figure 1. Dependence of the level of tourist activity on the degree of development of cultural services, museums, and collections of relics in 2008–2019 (r = 0.95; P < .0001).
Source. Formed by the author based on Beijing Municipal Bureau of StatisticsFootnote35; StatistaFootnote36; The Palace Museum.Footnote37
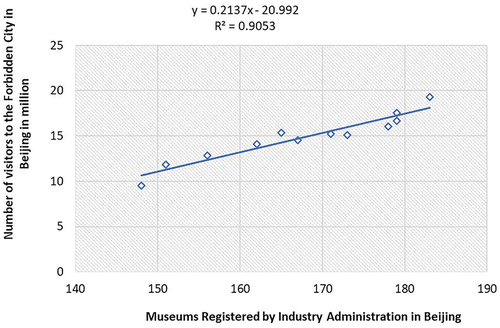
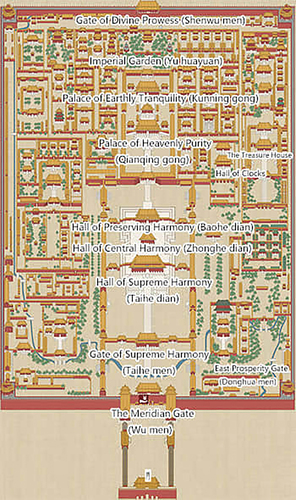
Figure 3. Forbidden city map of infrastructure.
Source. Formed by the author based on The Palace Museum.Footnote39
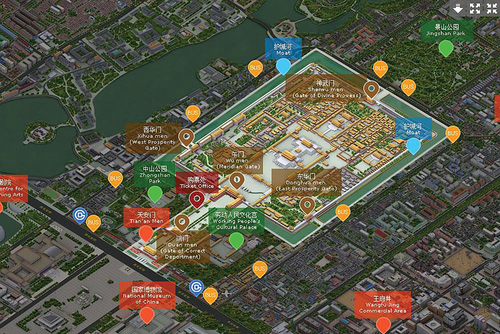
Figure 4. Satellite map with the typology of Forbidden City map area.
Source. Credit: © Google Earth.Footnote40
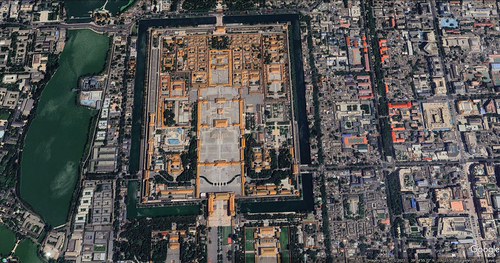
Figure 5. Beijing, China metro area population 1950–2022.
Source. Formed by the author based on the Macrotrends.Footnote41
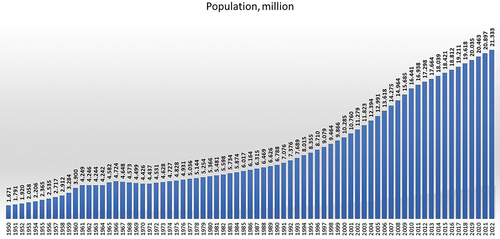
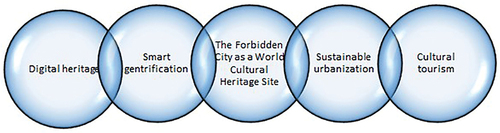
Figure 6. A model for managing the preservation of cultural heritage in a changing historic environment within the framework of sustainable development of the city.
Source. The authors’ development based on the analysis of concepts by Dandan et al.Footnote42, Mateoc-Sîrb et al.Footnote43, Qin et al.Footnote44