
Figures & data
Figure 1. Schematic of the chronic wasting disease (CWD) forensic analysis process. (a) Carcasses and remains were discovered at an illegal carcass dump site and within a white-tailed deer (WTD, Odocoileus virginianus) captive facility. Specimens were collected from both locations. (b) Specimens were anatomically assessed, age of the animals at time of death was estimated, and biological samples were collected. (c) Biological samples were tested through genetic and prion amplification methods. Data was analysed for the presence of CWD-causing prions, species identification, and the genetic relationship between individual samples and populations of WTD.
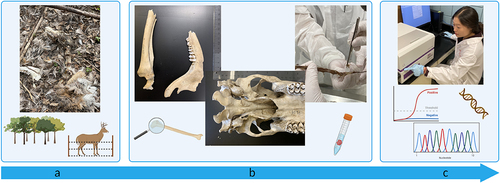
Figure 2. Samples demonstrating prion seeding via RT-QuIC. The normalized rate of amyloid formation (RAF) was utilized for a more direct, accurate way to visually compare the rates of reactions across multiple plates. The average RAF of positive plate controls on all plates has an equal hypothetical value of 1/h. RAF of negative control wells across all plates are presented as ‘Negative’. (a, b) Normalized RAF was plotted using data collected across multiple 96-well plates from CWD-positive samples from white-tailed deer remains at the carcass dump site and the captive facility, respectively. All samples shown exhibited amyloid seeding activity deemed statistically significant by Mann-Whitney U-test and Dunnett's test (p < 0.01) as compared to the negative control for each 96-well plate. Samples from the same animal are indicated by the animal ID above the associated, coloured box and whisker plots. (c) Normalized RAF was plotted using data collected across multiple 96-well plates from a subset of the CWD-negative samples from remains at the carcass dump site, which are the same sample types as CWD-positive samples in panels a and b (for direct comparison), and includes a non-cervid sample (MNM_E). (d) Normalized RAF was plotted using data collected across multiple 96-well plates from samples representing controls from CWD-positive (‘Samples from Positive Animals’) and CWD-not-detected (‘Samples from Not-Detected Animals’) white-tailed deer as determined by IHC and/or ELISA on medial retropharyngeal lymph node and/or obex. Alphanumeric identifiers associated with each dump site sample represent a location designation, where a set of or single bones were recovered. The numeric identifiers within the captive facility represent individually identified carcasses or carcasses parts within the captive facility. Alphanumeric identifiers associated with each control sample represent a laboratory identifier. The horizontal dashed line represents the average RAF minus one standard deviation of a statistically significant (RT-QuIC and ELISA) CWD-positive WTD parotid lymph node for a relative comparison of RAF. **=statistically significant by Mann-Whitney U-test and Dunnett's test (p < 0.01) as compared to the negative control, BM=bone marrow. CDM=cranial dura mater, CT=connective tissue, MS=muscle, LV=larvae, B=Brain, MN=mandibular nerve, MNM=maxilla; neurocranium, MNM_E=maxilla; neurocranium equine, SC=spinal cord, SN=sciatic nerve, SK=skin. Normalized RAF = true RAF of sampled well/normalization factor calculated from positive plate controls.
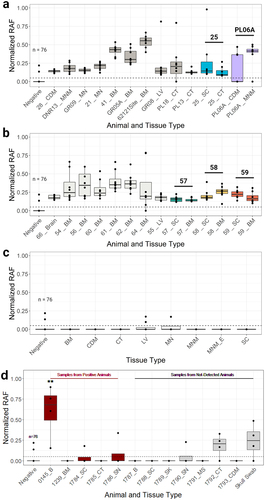
Figure 3. STRUCTURE results shown as barplots, with each bar representing an individual and its membership to assumed clusters (K = 2). (a) Top: Assignments obtained without including sample origin as a priori information. Bottom: assignments obtained including sample origin as a priori information. (b) Representative image demonstrating that the dump site and captive samples most closely aligned with each other and not with the wild samples collected near the sites and throughout Minnesota. Aligning with the bar colours in panel (a), the blue dots represent locations of wild population samples collected throughout the state, and orange dots represent samples from the dump site and captive herd and their relationship (locations are not exact).
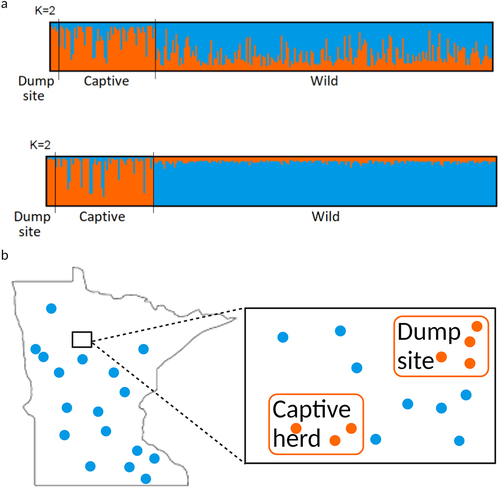
Figure 4. Discriminant Analysis of Principal Components (DAPC) results. (a) Barplot displaying each individual’s membership to three inferred population clusters. (b) Number of individuals assigned to each cluster.
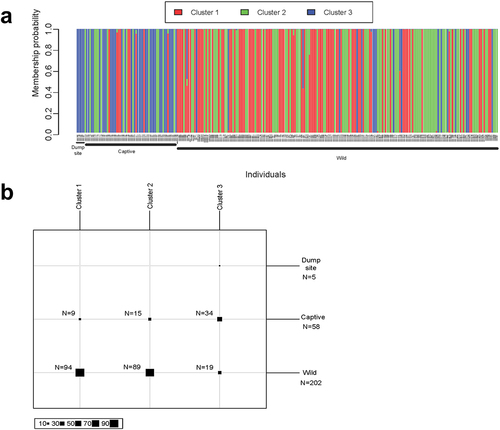
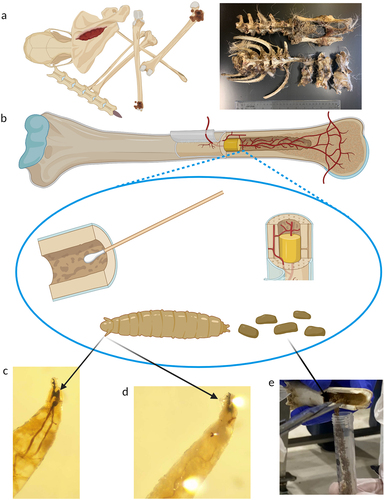
Figure 5. Atypical samples collected for a chronic wasting disease (CWD) investigation. (a) Bone remains from cervids with minimal exterior soft tissue available for prion and genetic analysis. (b) Bone cavities were sampled for prion detection and genetic analysis using surface swabs, bone marrow, fly larvae, and fly larval frass. (c, d) Characteristic morphological structures of 2nd and 3rd instar larva. Larvae were subsequently identified as Liopiophila varipes and Piophila nigriceps. (e) Collection of fly larval frass from the medullary cavity of a white-tailed deer metatarsal.
Supplemental Material
Download JPEG Image (107.1 KB)
Supplemental Material
Download JPEG Image (45.5 KB)
Supplemental Material
Download JPEG Image (98.3 KB)
Supplemental Material
Download JPEG Image (2.5 MB)
Data availability statement
The data supporting the findings of this study are available from the corresponding author, M.D.S., upon reasonable request.