Figures & data
Figure 1. Conceptual model of the present study.
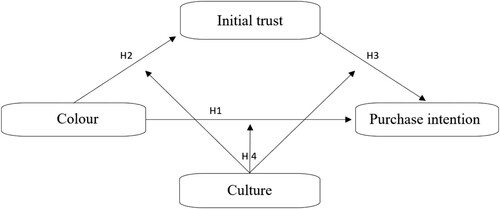
Table 1. Demographic information of the sample per cultural group (in percentages).
Figure 2. Laptop sleeve offered in a web store context: left with a blue colour (RGB code = 1A3650), and right with a red colour (RGB code = FF7F7F).
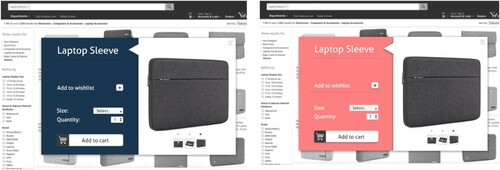
Table 2. Reported colour associations with trust per condition.
Table 3. Regression coefficients, standard errors (SE) and model summary information (based on 5000 bootstrap samples) for the effect of the colour model.
Figure 3. Model of colour as a predictor of purchase intention, mediated by trust.
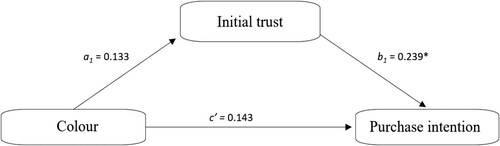
Figure 4. The effect of colour on purchase intention per culture. Means on a 5-point-scale, 1 = min. (completely disagree) and 5 = max. (completely agree).
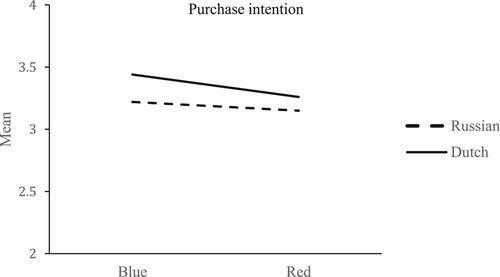
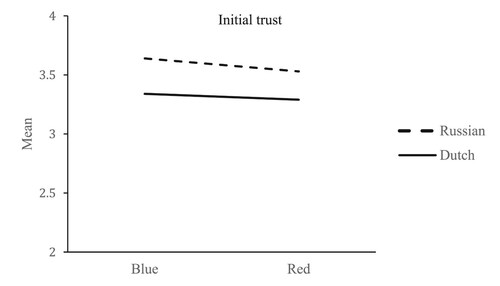
Figure 5. The effect of colour on initial trust per culture. Means on a 5-point-scale, 1 = min. (completely disagree) and 5 = max. (completely agree).