Figures & data
FIGURE 1 Similarity in FTIR spectra was recorded for (a) Cu2O and (b) CuO nanoparticles after calcination at 450°C in nitrogen for 4 h.
FIGURE 2 The same UV absorption spectrum was observed for (a) Cu2O and (b) CuO nanoparticles after calcination at 450°C in nitrogen for 4 h.
FIGURE 3 Thermo gravimetric analyses of copper oxide nanoparticles after calcination at 450°C in nitrogen for 4 h. (a) Cu2O and (b) CuO showing crystallization takes place after removal of impurities.
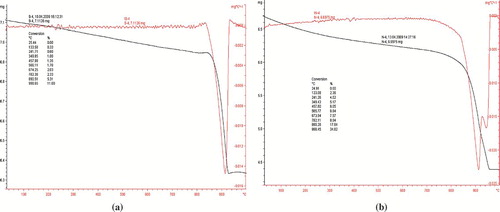
FIGURE 4 X-ray diffraction patterns of copper oxide nanoparticles after calcination at 450°C in nitrogen for 4 h support the presence of phase in Cu2O and CuO, respectively, whereas the diffraction peaks for Cu2O matches with CuO peaks, as illustrated in the figure: (a) Cu2O and (b) CuO nanoparticles.
FIGURE 5 SEM images of (a) Cu2O and (b) CuO nanoparticles after calcination at 450°C in nitrogen for 4 h, showing agglomerated particles due to weak inter-intra particle forces.
FIGURE 6 TEM images of (a) Cu2O and (b) CuO nanoparticles. After calcination at 450°C in nitrogen for 4 h, showing the uniform particle mapping and crystallinity supported by selected area electron diffraction pattern of copper oxide nanocrystals.