1,410
Views
0
CrossRef citations to date
0
Altmetric
Research Paper

Metabolome-associated psychological comorbidities improvement in irritable bowel syndrome patients receiving a probiotic

, , , , , , , , & show all
Article: 2347715 | Received 07 Jul 2023, Accepted 22 Apr 2024, Published online: 08 May 2024

Figures & data

Figure 1. Fecal BL NCC3001 relative abundance and associations with clinical outcomes.
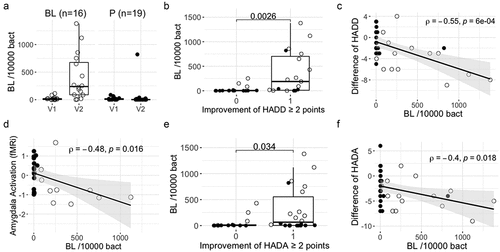
A) BL NCC3001 abundance in feces at baseline (V1) and at the end of intervention (V2) per group. B) Fecal BL NCC3001 abundance in responders [≥2 points improvement in HADD score (1)] and not responders [<2 points improvement in HADD score (0)]; p-value of Wilcoxon test. C) Correlation between the difference of HADD score (V2-V1) and BL NCC3001 abundance at V2; Spearman test. D) Correlation between amygdala activation (fMRi) and BL NCC3001 abundance at V2; Spearman test. E) Fecal BL NCC3001 abundance in responders [≥2 points improvement in HADA score (1)] and non-responders [<2 points improvement in HADA score (0)]; p-value of Wilcoxon test. F) Correlation between the difference in HADA score (V2-V1) and BL NCC3001 abundance at V2; Spearman test. BL NCC3001 (BL, open circle); Placebo (P, closed circle).
Figure 1. Fecal BL NCC3001 relative abundance and associations with clinical outcomes.

Figure 2. OPLS samples and variable plots.
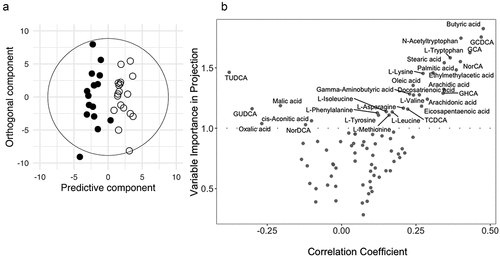
(A) OPLS Score plot derived from plasma metabolic profiles. The cross-validated scores plot showed statistically significant separations between the blood profiles obtained post-intervention from placebo (closed circle) and BL NCC3001 (open circle) treated patients. (B) OPLS variables plots describing influential variables contributing to the separation observed in the scores plots, according to variable importance in projection (threshold >1.0) and the correlation coefficient.
Figure 2. OPLS samples and variable plots.

Figure 3. Overview of changes in plasma fatty acids and bile acids.
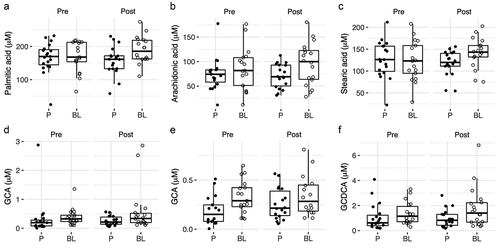
Concentrations of metabolites in plasma at baseline (V1) and end of intervention (V2) per group: A) palmitic acid, B) arachidonic acid, C), stearic acid, D) glycine conjugated cholic acid (GCA), E) glycine conjugated cholic acid (GCA) without outliers, F) glycine-conjugated chenodeoxy cholic acid (GCDCA). BL NCC3001 (BL, open circle); Placebo (P, closed circle).
Figure 3. Overview of changes in plasma fatty acids and bile acids.

Figure 4. Overview of changes in plasma tryptophan, N-Acetyl tryptophan, and associations with clinical endpoints.
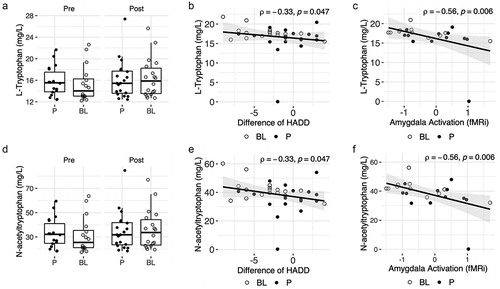
A) Concentrations of tryptophan in plasma at baseline (V1) and end of intervention (V2) per group, B) Correlation between the difference of HADD score (V2-V1) and tryptophan concentration in plasma at V2; Spearman test. C) Correlation between amygdala activation (fMRi) and tryptophan concentration in plasma at V2; Spearman test. D) Concentrations of N-acetyltryptophan in plasma at baseline (V1) and end of intervention (V2) per group, E) Correlation between the difference in HADD score (V2-V1) and N-acetyltryptophan concentration in plasma at V2; Spearman test. F) Correlation between amygdala activation (fMRi) and plasma N-acetyl-tryptophan concentration at V2; Spearman test. BL NCC3001 (BL, open circle); Placebo (P, closed circle).
Figure 4. Overview of changes in plasma tryptophan, N-Acetyl tryptophan, and associations with clinical endpoints.

Figure 5. Overview of changes in plasma butyric acid and associations with clinical endpoints and fecal BL NCC3001 counts.
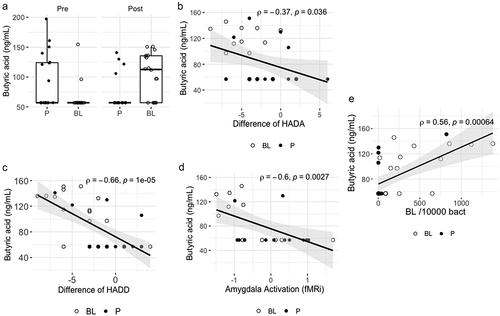
A) Concentrations of butyric acid in plasma at baseline (V1) and end of intervention (V2) per group, B) Correlation between the difference in HADA score (V2-V1) and butyric acid concentration in plasma at V2; Spearman test, C) Correlation between the difference in HADD score (V2-V1) and butyric acid concentration in plasma at V2; Spearman test. D) Correlation between amygdala activation (fMRi) and butyric acid concentration in the plasma at V2; Spearman test. E) Correlation between fecal BL NCC3001 abundance and butyric acid concentration in plasma at V2; Spearman test. BL NCC3001 (BL, open circle); Placebo (P, closed circle).
Figure 5. Overview of changes in plasma butyric acid and associations with clinical endpoints and fecal BL NCC3001 counts.

Table 1. Overview of plasma metabolite differences according to treatment and time.

Supplemental material

234393704_supplementary discussion.docx

Download MS Word (26.1 KB)