Figures & data
Figure 1. Pro-B ALL CD10+ (common B ALL). The blasts were selected and gated as they appear on the CD45 and SSC (green) (a). (b) cyCd79a versus SSC. (c) CD19 versus SSC. (d) CD34 versus SSC. (e) CD10 versus SSC.
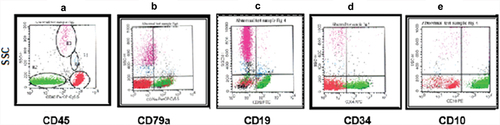
Figure 2. Pro B-ALL CD10–. The blasts were selected and gated as they appear on the CD45 and SSC (green) (a). Shown are plots of cyCd79a versus SSC (b), CD19 versus SSC (c), CD34 versus SSC (d), and CD10 versus SSC (e).
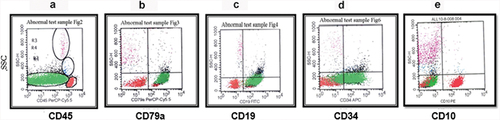
Figure 3. Pre-B ALL. The blasts were selected and gated as they appear on the CD45 and SSC (green) (a). Shown are plots of cyCd79a versus SSC (b), CD19 versus SSC (c), CD34 versus SSC (d), and cyIgM versus SSC (e).
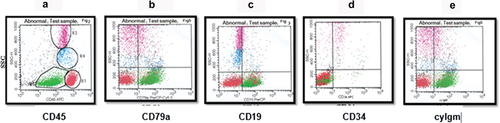
Table 1. Immunophenotyping of acute lymphoblastic leukemia: percentage of patients scoring positive for given markers.
Figure 4. Mature B-ALL. The blasts were gated and colored green. (a) dot plot of CD45 versus SSC by which leukemic cells are selected. (b) the plot shows the expression of CD79a on blast cells. (c) dot plot of CD20 versus SSC. (d) dot plot shows the absence of CD34 expression. (e) dot plot of IgM versus SSC with the positive expression of IgM.
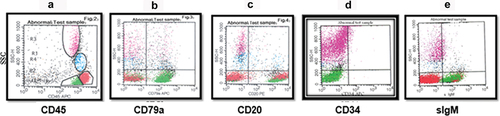
Figure 5. Shown are representative dot plots for the expression of surface and intracellular antigens of T-ALL leukemic cells. (a) CD45 versus SSC with a high percentage of blasts (green). Strong expression of cyCD3 (b), CD2 (c), CD7 (d) and CD5 (e) on the blast cells (green).
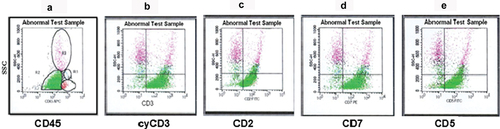
Table 2. Immunophenotyping of acute lymphoblastic leukemia: distribution of ALL subtypes by gender.
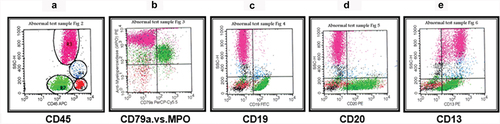
Figure 6. Biphenotypic acute leukemia (BAL). The blasts (green) were gated on CD45 versus SSC dot plot (a). Shown is the expression of cyCd79a versus MPO (b), CD19 (c), CD20 (d) and the myeloid-specific antigen of CD13 (e).