
Figures & data
Table 1. The existing numerical studies on surface roughness effect on transition.
Figure 1. Three-dimensional micro-ramp geometry (Ye et al., Citation2016a).
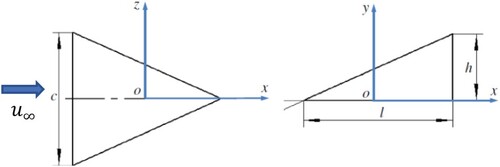
Table 2. Grid parameters for sub-zones.
Figure 2. Mesh around the micro-ramp (a) and in the LES/RANS sub-zones (b).
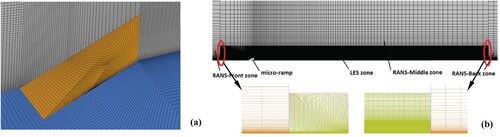
Figure 3. Undisturbed boundary layer velocity profiles.
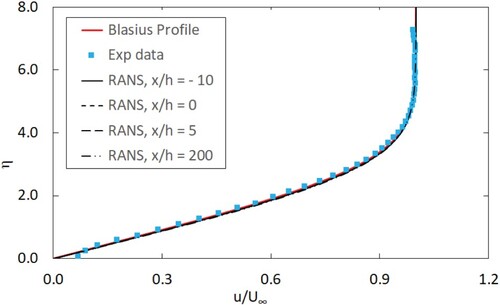
Table 3. Laminar boundary layer integral parameters.
Figure 4. Time-averaged streamwise velocity contours and streamlines in y-z planes (Left: present ELES; Right: experiment (Ye et al., Citation2016a)).
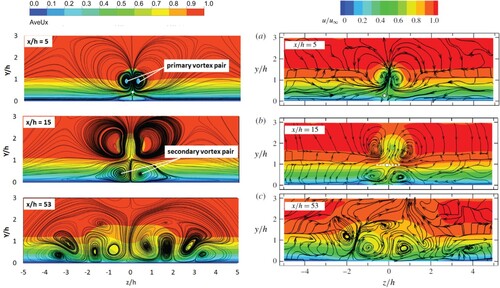
Figure 5. Iso-surface contour of time-averaged streamwise vorticity (Left: present ELES; Right: experiment Ye et al., Citation2016a).
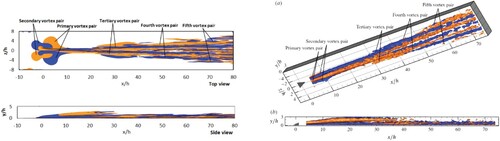
Figure 6. Time-averaged streamwise velocity profiles in the symmetry plane.
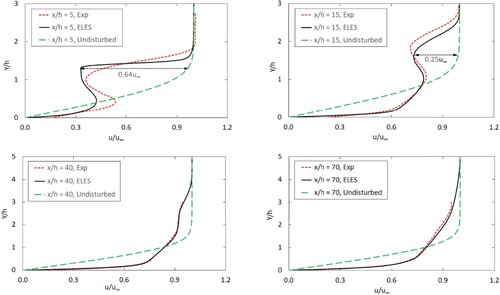
Figure 7. Evolution of maximum velocity deficit.
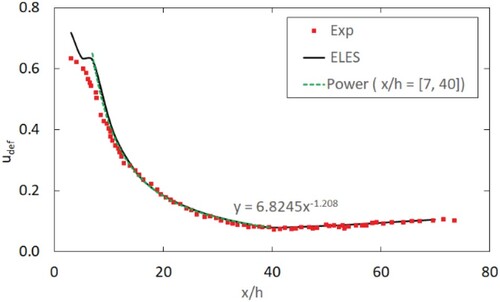
Figure 8. Spanwise distribution of time-averaged velocity at streamwise locations .
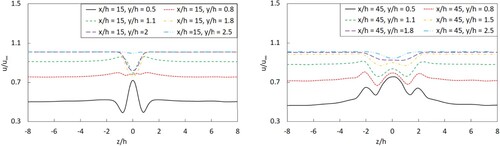
Figure 9. Spanwise distribution of velocity fluctuation at streamwise locations .
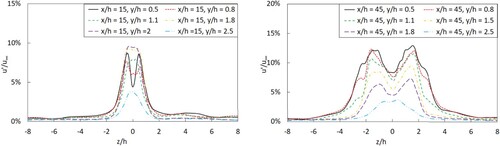
Figure 10. Streamwise velocity semi-log profile in symmetry plane .
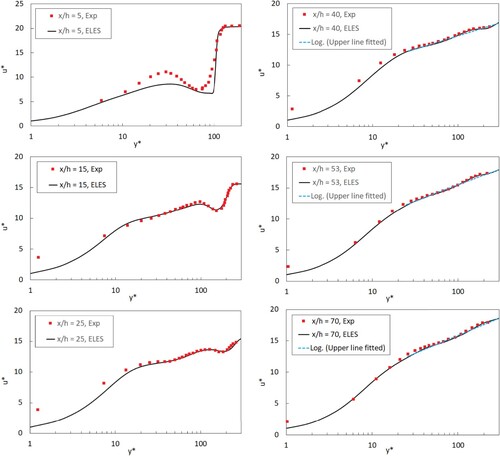
Figure 11. Instantaneous vortex structure detected by the iso-surface of criterion (Left: present ELES; Right: experiment (Ye et al., Citation2016a)).
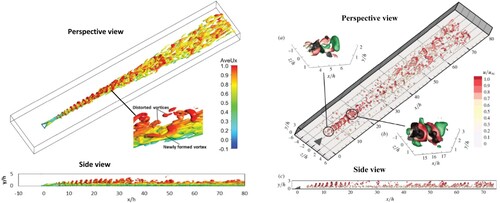
Figure 12. Mean separation bubble around the micro-ramp.
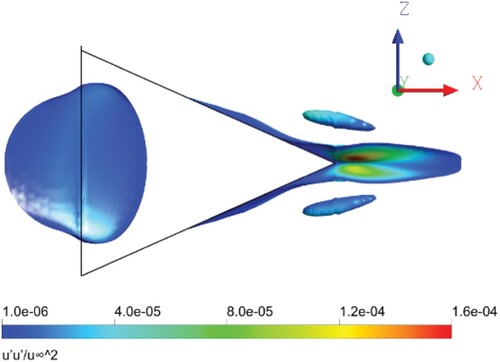
Figure 13. Contours of rms streamwise velocity fluctuations in y-z planes (Left: present ELES, Right: experiment (Ye et al., Citation2016a)).
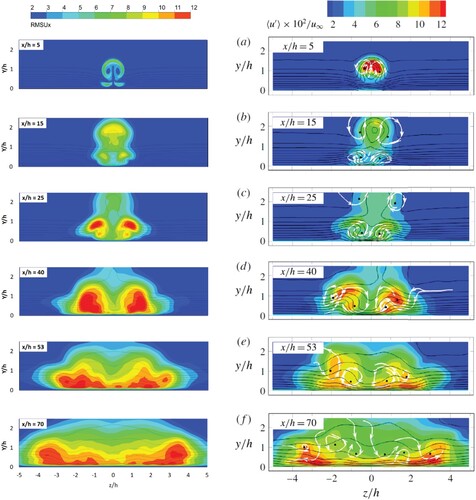
Figure 14. Contours of rms wall-normal velocity fluctuations in y-z planes (Left: present ELES, Right: experiment (Ye et al., Citation2016a)).
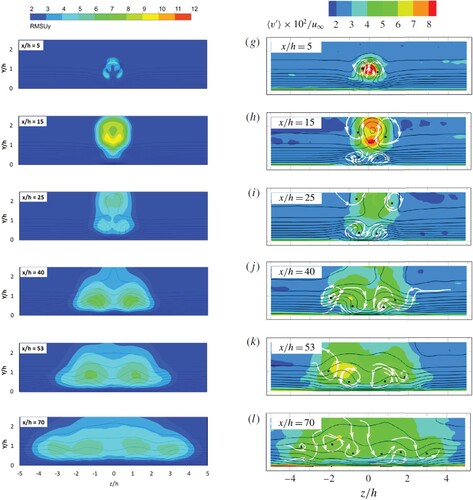
Figure 15. Contour of streamwise velocity fluctuations in the x-y plane at (Top: present ELES, Bottom: experiment (Ye et al., Citation2016a)).
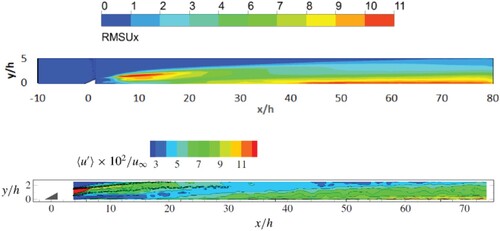
Figure 16. Contours of the turbulence production in y-z planes (Left; present ELES; Right: experiment (Ye et al., Citation2016a)).
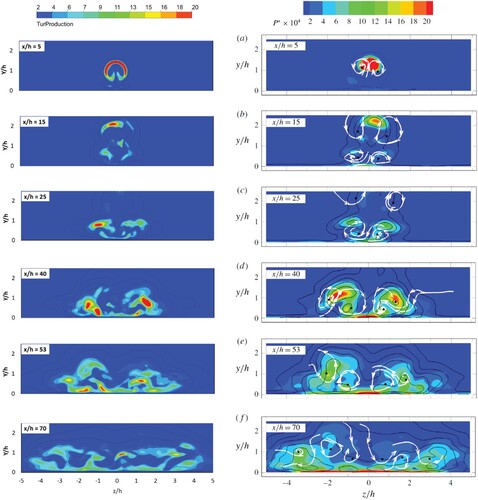
Figure 17. Turbulent wedge formation (Left: present ELES; Right: experiment (Ye et al., Citation2016a).
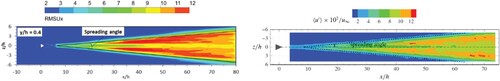
Figure 18. Profiles of velocity fluctuation and TKE in the turbulent wedge.
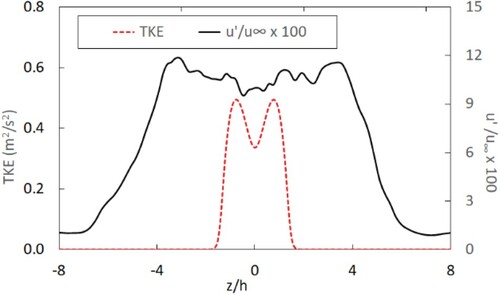
Table 4. Effect of micro-ramp roughness element on drag coefficient .
Data availability statement
The data that support the findings of this study are available from the corresponding author Y. Lin [[email protected]] upon reasonable request.