Figures & data
Table 1. Inclusion and exclusion criteria for the selection of patients.
Figure 1. Flow chart of the treatment protocol and the sampling time points during the revitalization procedures.
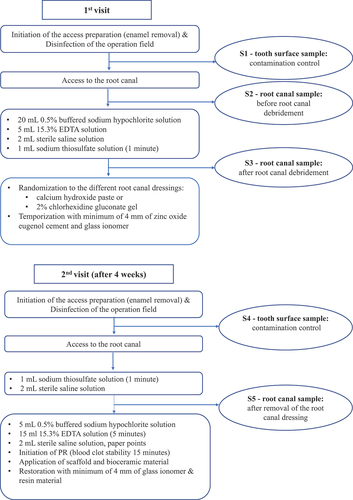
Figure 2. Flow chart of data collection of eligible root canal samples.
Figure 3. Average number of CFU per sample in the successful pulp revitalization cases(n = 29) vs the failed PR cases (n = 12) at each sampling time point (S2, S3, and S5).
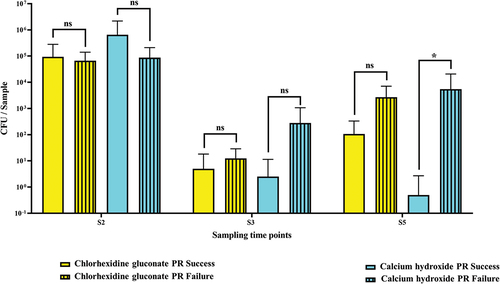
Figure 4. Average number of taxa per sample in the successful pulp revitalization cases(n = 29) versus the failed pulp revitalization cases (n = 12) at each sampling time point (S2, S3, and S5).
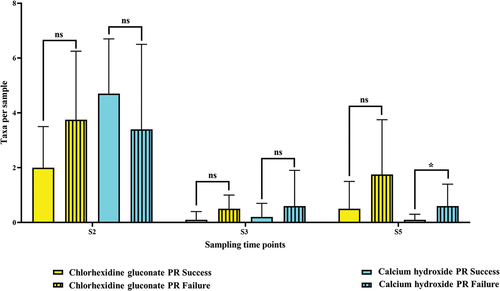
Figure 5. Disinfection efficacy in the successful vs. failed pulp revitalization cases, calcium hydroxide and chlorhexidine subgroups.
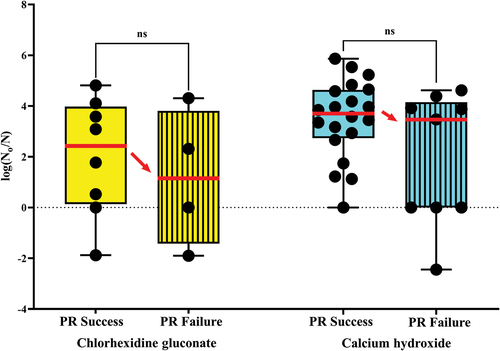
Figure 6. Primary bacterial taxa from all samples before root canal debridement (S2) cultured in both outcomes of successful and failed pulp revitalization (n = 41).
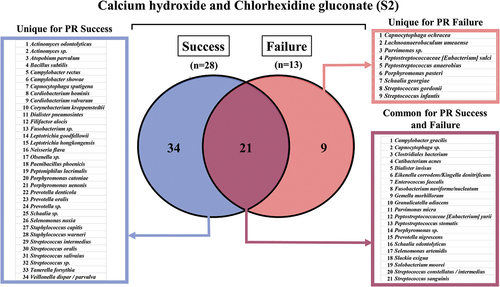
Figure 7. Phylum diversity between successful and failed pulp revitalization outcomes in relation to the substance used for the root canal disinfection.
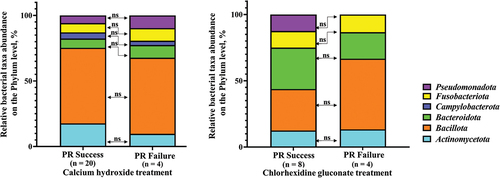
Figure 8. Bacterial load on the phyla associated with both outcomes of pulp revitalization in the calcium hydroxide subgroup.
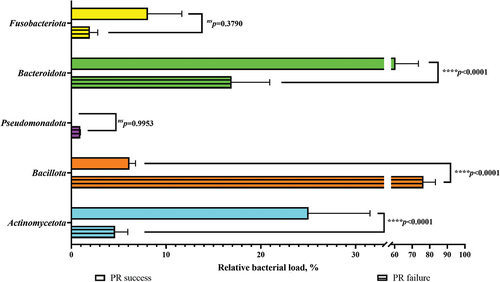
Figure 9. Bacterial load on the phyla level associated with both outcomes of pulp revitalization in the chlorhexidine subgroup.
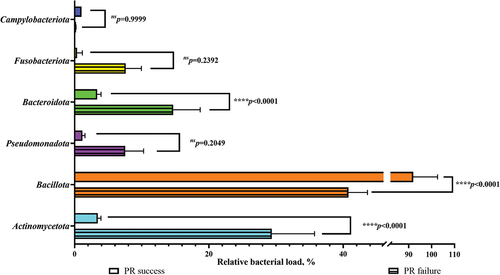
Figure 10. Bacterial taxa cultured in all cases from the calcium hydroxide subgroup (pulp revitalization treatment – success and failure at all time points).
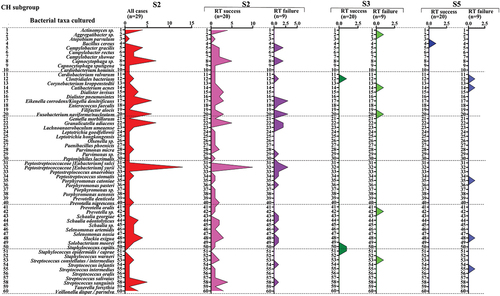
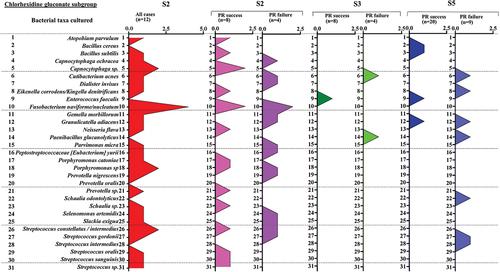
Figure 11. Bacterial taxa cultured in all cases from the chlorhexidine subgroup (pulp revitalization treatment – success and failure at all time points).