Figures & data
Table 1. Differences in demographic and clinical characteristics between CRC, CP, and NC groups.
Figure 1. Comparison of relative abundance among each group. (a) Relative abundance of tongue coating microbiota at the genus level. (b) Relative abundance of tongue coating microbiota at the species level. (c) Heat map plot of relative abundance of the top 25 species in each sample (The legend of panel c in this figure is as same as the legend of panel b).
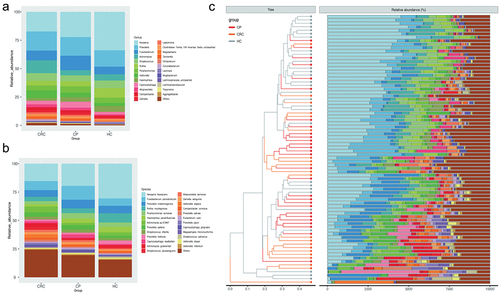
Figure 2. Microbial diversity analysis among three groups. (a,b) α-diversity indexes in the CRC, CP, and HC groups (observed, diversity Shannon and Simpson indexes depict diversity). (c) PCoA for β-diversity analysis. Red, orange, and grey represent different samples from the three groups. The structure and composition of the tongue coating microbiota were significantly different among the three groups. (d) Numbers of enriched OTUs between each compartment. Statistical significance by *p < 0.05, **p < 0.01, ***p < 0.001, ****p < 0.0001; ns, non-significant. HC: healthy controls, CP: patients with colorectal polyps (CP), CRC: patients with colorectal cancer.
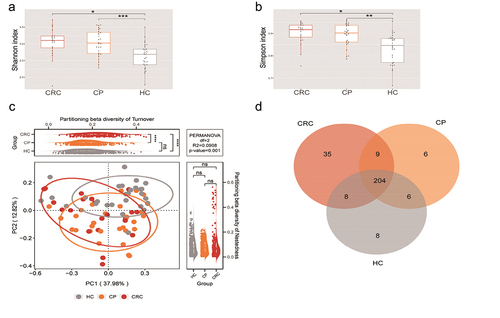
Figure 3. Phylogenetic differences among three fur-types. (a) A BCA plot for showing the different species of three fur-types. (b) The top 10 contributors of three fur-types showing a different trend among groups. (c) Frequency of tongue coating types in the three groups. Statistical significance by *p < 0.05, **p < 0.01, ***p < 0.001, ****p < 0.0001; ns, non-significant. BCA: between class analysis, which visualizes results from principal component analysis and clustering; HC: healthy controls, CP: patients with colorectal polyps (CP), CRC: patients with colorectal cancer.
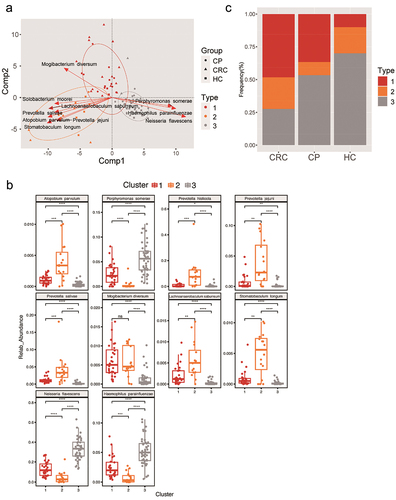
Figure 4. Differences in tongue coating microbiota from phylum to species in the CRC, CP, and HC groups. (a) Microbiome biomarkers were identified using a logarithmic linear discriminant analysis (LDA) effect size (LefSe) threshold > 2.0. (b) HeatTree for clustering analysis. Red indicates a significant increase of abundance, while blue depicts the opposite. (c) Co-occurrence network analysis of tongue coating microbiota using Pearson’s correlation coefficient. A node represents a species. The node size indicates the level of abundance. Color scale indicates the proportion of bacterium in the three groups separately. Red depicts CRC patients, green depicts CP while purple depicts HC. Connecting lines indicate the strength of the relationship. HC: healthy controls, CP: patients with colorectal polyps (CP), CRC: patients with colorectal cancer.
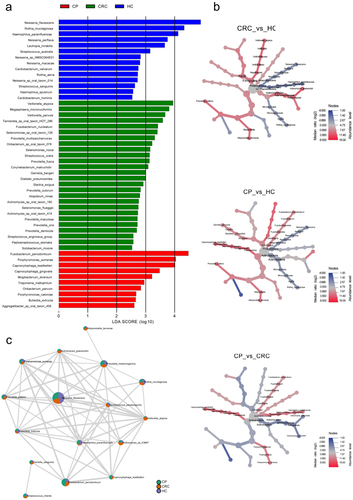
Figure 5. Heatmap analysis of the correlation between tongue coating microbiota composition and clinical indexes. The heatmap of the multivariable model describing the top associations between the independent variables and bacterial features. Positive associations are in red, while inverse associations are in blue. The color gradient represents the strength of the association, with darker colors representing stronger associations. The effect size was calculated by the following formula: (−log(qval)*SIGN (coeff)). Cr: creatinine, GLB: globulin, ALB: albumin, TP: total protein, AST: aspartate aminotransferase, TC: total cholesterol, LY: lymphocyte.
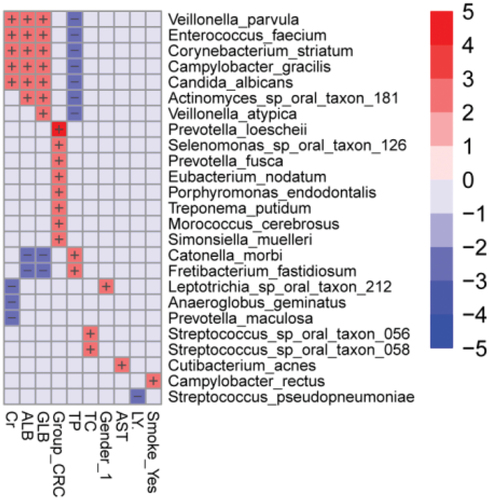
Figure 6. Enrichment of functional pathways of differential bacteria among the three groups. (a) LDA values of different pathways in samples from the three groups. (b,c) Relative contribution of tongue coating microbes to pathways in CRC patients. (d,e) Relative contribution of tongue coating microbes to pathways in CP patients. (f,g) Relative contribution of tongue coating microbes to pathways in HC samples. Enrichment was defined as p < 0.05, q < 0.1, and LDA > 2.0. HC: healthy controls, CP: patients with colorectal polyps (CP), CRC: patients with colorectal cancer.
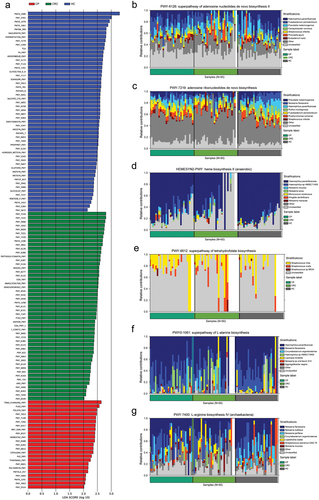
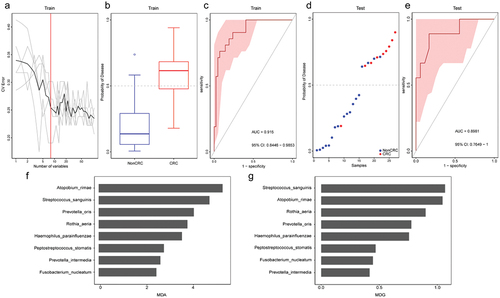
Figure 7. Tongue coating microbiome as a non-invasive diagnostic model for CRC. (a) The random forest models to identify eight species as optimal biomarkers, using the cross-validation error curve. (b) The POD value in the discovery cohort. (c) Receiver operating characteristic (ROC) in the discovery cohort. (d) The POD value in the validation cohort. (e) ROC for the validation cohort samples. (f-g) MDA and MDG of attributes as assigned by the random forest. POD, probability of disease; CV error, cross-validation error; AUC, area under the curve; CRC, Patients with CRC; NonCRC, colonoscopy-negative controls or patients with colorectal polyps; MDA, Mean Decrease Accuracy; MDG, Mean Decrease Gini.