
Figures & data
Figure 1. Presentation of the EV-TRACK study summary add-on.
The main page of the summary add-on (upper panel) contains general study information including the number of EV experiments performed, the origin of EVs (species and sample type) and a summary of the separation protocol reported in the study. The average EV-METRIC value given in the upper table is detailed in doughnut charts with visualization of the nine components of the EV-METRIC for the individual study experiments. Depending on the separation and characterization methods implemented, ultracentrifugation specifics, antibody specifics and lysate preparation are applicable or not. For studies with more than two experiments, the EV-METRIC of individual experiments is represented on a radar chart. The study tree (lower panel) shows a summary of the separation protocol of study experiments and their individual EV-METRIC. Extended information on the separation protocols and characterization methods employed for each experiment, can be accessed by clicking on the EV-TRACK ID. For more information on the composition, calculation and use of the EV-METRIC we refer to [Citation13] and evtrack.org/about.php. Abbreviations: DG: density gradient; dUC: differential ultracentrifugation.
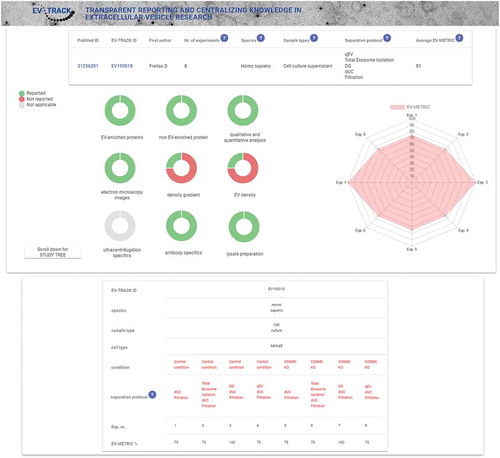
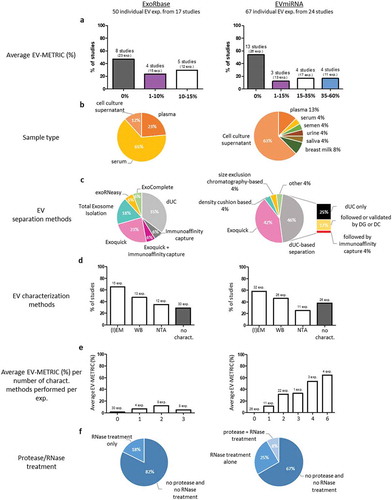
Figure 2. EV-TRACK analysis of ExoRbase and EVmiRNA publications.
Studies considered in ExoRbase as experimental validation studies for blood-EV RNA (50 individual EV experiments, 17 studies) and studies contributing to EVmiRNA datasets (67 individual EV experiment, 24 studies) were submitted to EV-TRACK and analysed. For each study, the average EV-METRIC was calculated based on the reporting of the separation and characterization components represented in [Citation13]. The number of experiments in studies achieving a certain EV-METRIC is indicated in brackets (a). The percentage of studies separating EVs from a given sample type (b), using a selected EV separation method (c), and implementing a RNase and/or protease treatment prior to RNA isolation in at least one experiment (f) are represented in pie charts. The most frequently performed EV characterization methods are represented as the percentage of studies using a given method to characterize EVs in at least one experiment (d). The total number of experiments characterized with a given method are indicated on top of the bars. The percentage of studies and the total number of experiments performing no EV characterization are also included (d). The average EV-METRIC achieved by experiments in function of the number of methods employed to characterize EVs is represented in (e). The number of experiments concerned is indicated. Characterization methods considered for this analysis include western blot (WB), nanoparticle tracking analysis (NTA), dynamic light scattering (DLS), enzyme-linked immunosorbent assay (ELISA), electron microscopy (EM), immunoelectron microscopy (IEM), density gradient (DG), density cushion (DC), proteomics and flow cytometry after specific tetraspanin-mediated association of EVs with beads. Abbreviations: dUC: differential ultracentrifugation.
Data availability statement
All data that were collected during the course of this study, and that support its findings are available online http://evtrack.org.