Figures & data
Figure 1. DiD-labelling and analysis of ATP-induced J774 EVs. J774 cells were stimulated with ATP (3 mM, 30 min), and the released EVs labelled with DiD and analysed by flow cytometry. (a): Comparison with fluorescent sizing calibration beads (Sperotech) indicated that the forward scatter (FSc) of most DiD-positive events (R1) was lower than that of the 1.3 µm beads and all lower than the ~6 µm diameter Accucheck counting beads (R2). Incubation of samples with non-ionic detergent (Triton X-100, 0.1%) resulted in the disappearance all DiD-positive events consistent with their vesicular nature [Citation78], while incubation and centrifugation of DiD in buffer without EVs (PBS-DiD) produced relatively few fluorescence-positive events (b): The subcellular origin of DiD-positive J774 EVs was assessed by staining with phycoerythrin-conjugated monoclonal antibodies (mAb) against typical myeloid cell membrane (CD45, CD11b) and exosome (CD9, CD63, CD81, LAMP2) markers. Positive staining of EVs (main histogram overlays) corresponded well to the staining pattern of viable untreated J774s (inset histogram overlays), suggesting DiD-positive EVs were derived mainly from the plasma membrane. Note that J774 cells do express CD9, CD81 and LAMP2, but not CD63 on their surface. Surface exposure of phosphatidylserine (PS) on DiD-labelled EVs was evident from their staining with FITC-conjugated annexin V and its reversal by incubation with the calcium cation chelator EGTA (5 mM). (c): The majority of DiD fluorescence in labelled samples was present in CD45+ EVs bound to and eluted from anti-CD11b conjugated immunomagnetic microbeads, with very low levels of fluorescence in the unbound column flow-through. (d): Serial 2-fold dilutions of DID-labelled EV preparations indicated linearity and correlation (Pearson correlation coefficient) in the detectable range of DiD fluorescence units (FU) measurement and the flow cytometric MV counts (DiD/CD11b double-positive events).
![Figure 1. DiD-labelling and analysis of ATP-induced J774 EVs. J774 cells were stimulated with ATP (3 mM, 30 min), and the released EVs labelled with DiD and analysed by flow cytometry. (a): Comparison with fluorescent sizing calibration beads (Sperotech) indicated that the forward scatter (FSc) of most DiD-positive events (R1) was lower than that of the 1.3 µm beads and all lower than the ~6 µm diameter Accucheck counting beads (R2). Incubation of samples with non-ionic detergent (Triton X-100, 0.1%) resulted in the disappearance all DiD-positive events consistent with their vesicular nature [Citation78], while incubation and centrifugation of DiD in buffer without EVs (PBS-DiD) produced relatively few fluorescence-positive events (b): The subcellular origin of DiD-positive J774 EVs was assessed by staining with phycoerythrin-conjugated monoclonal antibodies (mAb) against typical myeloid cell membrane (CD45, CD11b) and exosome (CD9, CD63, CD81, LAMP2) markers. Positive staining of EVs (main histogram overlays) corresponded well to the staining pattern of viable untreated J774s (inset histogram overlays), suggesting DiD-positive EVs were derived mainly from the plasma membrane. Note that J774 cells do express CD9, CD81 and LAMP2, but not CD63 on their surface. Surface exposure of phosphatidylserine (PS) on DiD-labelled EVs was evident from their staining with FITC-conjugated annexin V and its reversal by incubation with the calcium cation chelator EGTA (5 mM). (c): The majority of DiD fluorescence in labelled samples was present in CD45+ EVs bound to and eluted from anti-CD11b conjugated immunomagnetic microbeads, with very low levels of fluorescence in the unbound column flow-through. (d): Serial 2-fold dilutions of DID-labelled EV preparations indicated linearity and correlation (Pearson correlation coefficient) in the detectable range of DiD fluorescence units (FU) measurement and the flow cytometric MV counts (DiD/CD11b double-positive events).](/cms/asset/ba916e32-4f8c-4210-a069-29a9fb2057a9/zjev_a_1706708_f0001_oc.jpg)
Figure 2. Uptake of circulating MVs during low-grade systemic inflammation. DiD-labelled MVs (240,000 FU) were injected i.v. into untreated or low-dose LPS-treated (20 ng, i.v. 2 h) mice. At 1 h post-MV injection, lungs, liver and spleen were harvested for preparation of fixed single-cell suspensions and analysis by flow cytometry. Histograms overlay plots are shown from individual mice for cell-associated DiD fluorescence in lung monocyte Ly6Chigh and Ly6Clow subsets (a). DiD MFI values for MV- and LPS+MV-treated mice are displayed in each plot. Cell-associated DiD fluorescence is indicated (mean fluorescence intensity: MFI) as a measure of MV uptake per cell in each of the cell populations (b–d). Data are displayed as mean ± SD and analysed by two-way ANOVA with Bonferroni correction tests. n = 4–5, *p < 0.05, **p < 0.01, ***p < 0.001.
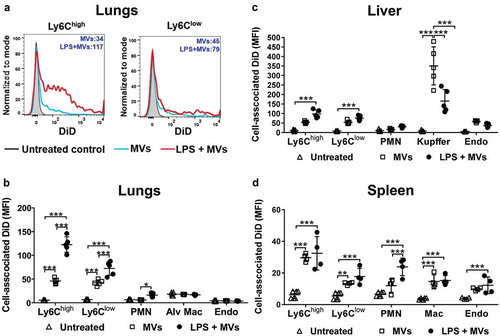
Figure 3. Organ cell counts and redistribution of MV uptake. Total cell counts for fixed (macrophages and endothelial cells) and non-fixed (monocytes and neutrophils) populations were determined for lungs, liver and spleen at 2 h after low-dose LPS injection (20 ng, i.v.)(a–c). Total uptake of MVs and per each organ type (d–f) was estimated (see Methods) by calculating the individual mouse cell-associated DiD MFI values (data in ) × group mean cell counts/organ (a–c). Cell count data are displayed as mean ± SD and analysed by two-way ANOVA with Bonferroni correction tests. n = 4, *p < 0.05, ***p < 0.001. Total MV uptake per organ is shown as cell population means in stacked bar plots.
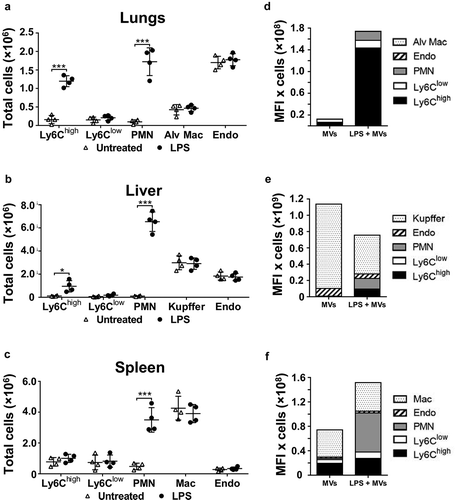
Figure 4. MV uptake by pulmonary vascular cells in macrophage-depleted mice. Mice were injected with clodronate-liposomes (“clod-lipo”) (i.v., 0.2 ml) and at 72 h, when Ly6Chigh monocytes, but not macrophages or Ly6Clow monocytes, were fully repopulated from bone marrow, mice were injected i.v. with low-dose LPS (20 ng) followed by DiD-labelled MVs after 2 h. Repopulation of Ly6Chigh monocytes in clodronate-treated mice was confirmed in lungs with their numbers similar to normal mice and substantially increased at 2 h post-LPS injection (a). Counts of circulating DiD-labelled MVs were determined in plasma at 1 h post-i.v. injection in normal and clodronate-liposome pre-treated mice (−72 h) (b). Cell-associated DiD levels (MFI) were determined in intravascular populations, including the remaining Ly-6Clow monocytes, at 1 h after MV injection, (c). Data are displayed as mean±SD and analysed by one-way ANOVA with Bonferroni correction tests. n = 4, *p < 0.05, **p < 0.01, ***p < 0.001.
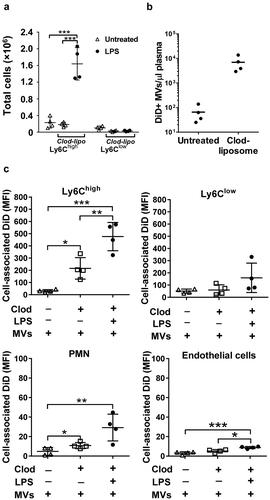
Figure 5. MV uptake in isolated perfused lungs (IPL). Lungs from normal or low-dose LPS-treated (20 ng i.v., 2 h) mice were perfused and mechanically ventilated using the IPL system. After a brief, slow flow-rate flush (5 min) to remove non-marginated cells, DiD-labelled MVs (240,000 FU) were infused into the perfusion circuit and recirculated for 1 h followed by determination of cell-associated DiD levels (MFI). Data are displayed as mean ± SD and analysed by t-tests. n = 3, *p < 0.05.
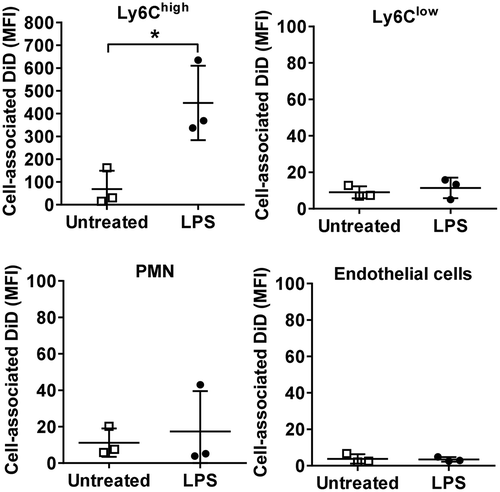
Figure 6. Lung-marginated Ly6Chigh monocytes internalize MVs. (a): Intravascular cells harvested from mice by high flow rate pulmonary artery perfusion (non-enzymatic) were incubated in suspension with DiD-labelled MVs (100,000 FU/ml) for 1 h. Cell-associated DiD levels (MFI) were compared in monocyte subsets and neutrophils in lung perfusates from normal and low-dose LPS-treated (20 ng, i.v. 2 h) mice. (b): MV uptake by Ly6Chigh monocytes from LPS-treated mice was assessed by confocal imaging (1000×) of membrane-localized anti-Ly6C antibody (Alexa Fluor 488-conjugated) and nuclear staining with DAPI. In MV-treated cells (lower row), the DiD signal (red) was intracellular and not co-localized with Ly6C. (c): MV internalization was assessed quantitatively by: (1) trypsin treatment of cells post-MV-DiD incubation to remove any surface-bound MVs; (2) MV-cell co-incubation at 4°C or energy depletion (NNA: NaF, NaN3 and antimycin A) to differentiate between active and passive uptake; or (3) inhibitors of cytoskeleton rearrangement (Cyt-D: cytochalasin D) and dynein (Dyn: dynasore) to inhibit endocytic processes. All numerical data are displayed as mean ± SD and analysed by t-tests ((c): MV only vs. NNA treatment); one-way ANOVA ((c), except NNA); two-way ANOVA (a) with Bonferroni correction tests. n = 3–5.
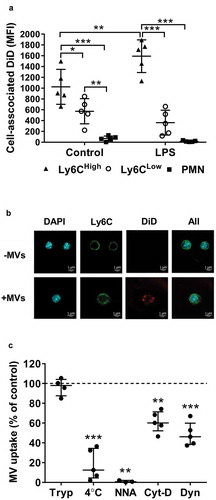
Figure 7. Receptor-dependent mechanisms of MV uptake by lung-marginated Ly6Chigh monocytes. (a) & (b): In vivo expression of PS and scavenger receptors on monocyte subsets were determined in lung single cell suspensions from normal and LPS-treated mice (20 ng, i.v. 2 h) by flow cytometry. (c): MV uptake by lung Ly6Chigh monocytes isolated by perfusion of individual LPS-treated mice was assessed in the presence of PS liposomes (PS-lipo) or RGDS peptide, in comparison to the respective controls, PC liposomes (PC-lipo) and RGES peptide. (d): MV uptake by lung Ly6Chigh monocytes from individual LPS-treated mice was similarly assessed in the presence of scavenger receptor A blockers: polyinosinic acid (Poly-I) and dextran sulphate (D-S), in comparison to the respective controls, polycytidylic acid (Poly-C) and chondroitin sulphate (C-S). Data are displayed as mean ± SD and analysed by multiple t-tests (a,b), one-way ANOVA with Bonferroni correction tests ((c), peptide blocking), or as median ± IQR and analysed by Friedman with Dunn’s correction tests ((c), liposome blocking; (d)). n = 3 for receptor expression and n = 3–5 for blocking experiments.
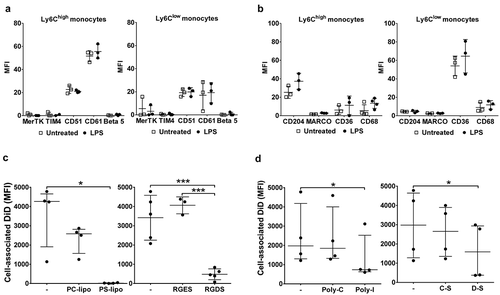
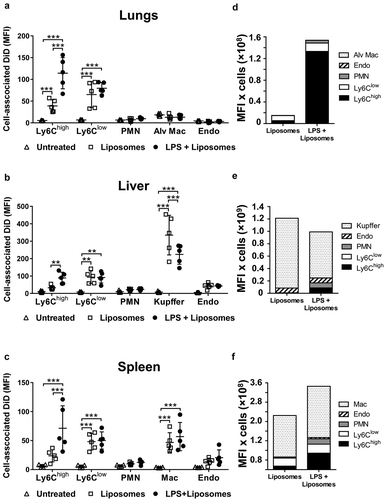
Figure 8. Uptake of circulating PS liposomes during low-grade systemic inflammation. DiD-labelled liposomes were injected i.v. into untreated or low-dose LPS-treated (20 ng, i.v. 2 h) mice. At 1 h post-MV injection, lungs (a), liver (b) and spleen (c) were harvested for preparation of fixed single-cell suspensions and analysis by flow cytometry. Cell-associated DiD fluorescence is indicated (MFI) as a measure of liposome uptake per cell in each of the cell populations. Total uptake of PS-liposomes and per each organ type (d–f) was estimated (see Methods) by calculating the individual mouse cell-associated DiD MFI values (a–c) × group mean cell counts/organ (data in ). Data are displayed as mean ± SD and analysed by two-way ANOVA with Bonferroni correction tests. n = 5, **p < 0.01, ***p < 0.001.