
Figures & data
Figure 1. PRISMA diagram of systematic review on diabetes cost of illness.
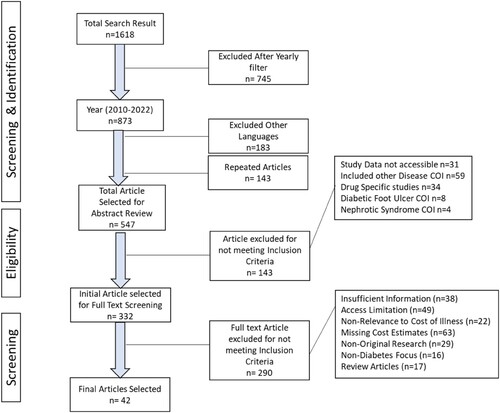
Figure 2. Yearly review of publication data.
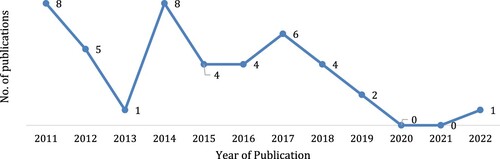
Figure 3. Geographical representation of Reviewed Data. *AUS: Australia. Other: No Specific region.
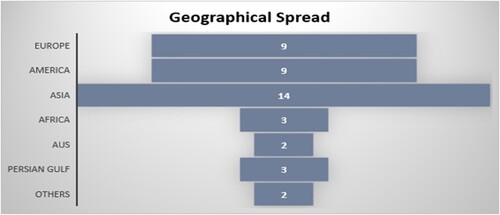
Figure 4. Different methods are used for the estimation of diabetes cost of illness. *SUM: Sum of all Medical costs, RB: Regression Bias, SDS: Sum diagnosis-specific, WTP: Willingness to pay.
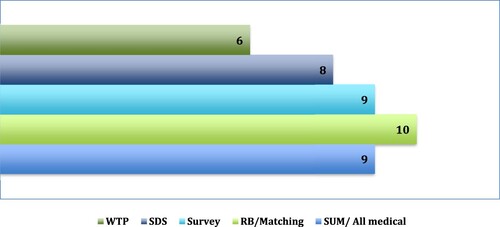
Table 1. Cost components of patients reporting data average reporting data (USD).
Table 2. Average Reporting Data (USD) Outpatient Cost Components from records.
Table 3. Prevalence-based study direct expenses by estimation technique and financial status in USD.
Figure 5. Annual cost/patient in high-income countries.
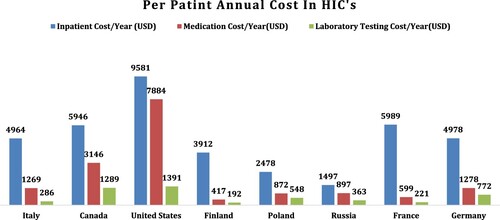
Figure 6. Annual cost/patient in lower-middle-income Countries.
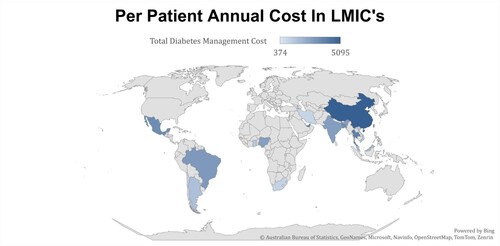
Table 4. Per patient medication cost per annum.
Appendix Table 1: Country coding for Data Evaluation.
Appendix Table 2: Cost of Illness of Diabetes