
Figures & data
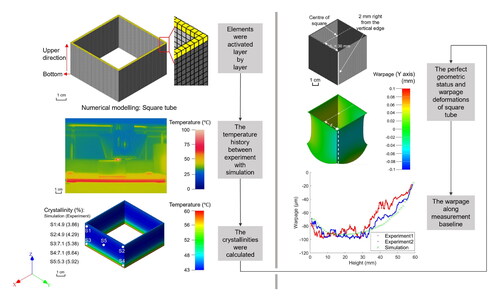
Figure 1. (a) 3D printer, (b) specimens (CT and ST composite structures) with basic geometric parameters and five measurement points.
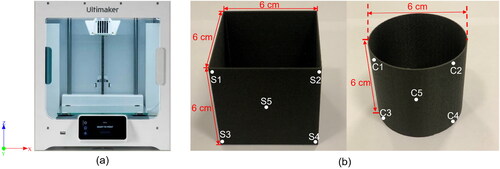
Figure 2. Meshwork and schematic to illustrate the calculation process using active elements.
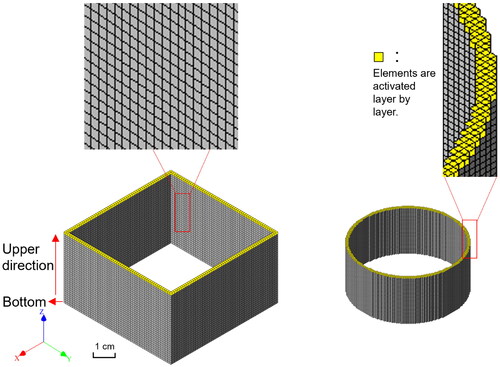
Figure 3. Flowchart for numerical modelling of the FFF process for composite parts.
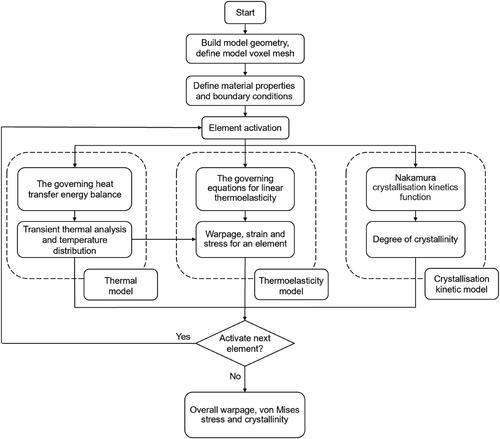
Figure 4. (a) Specific volume (b) specific heat capacity (c) Young’s modulus and (d) thermal conductivity versus temperature [Citation43–46].
![Figure 4. (a) Specific volume (b) specific heat capacity (c) Young’s modulus and (d) thermal conductivity versus temperature [Citation43–46].](/cms/asset/ae7df31c-92a9-4d39-88ca-735b9bbc8412/yadm_a_2171940_f0004_c.jpg)
Table 1. Primary material parameters used in the numerical simulation.
Figure 5. DSC results of heat flow versus temperature curves at five measurement points of (a) ST and (b) CT composite specimens.
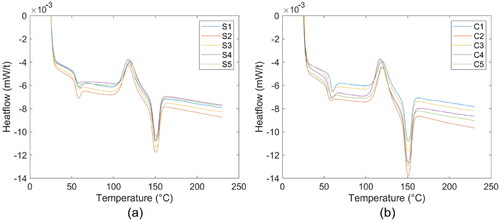
Figure 6. Temperature distribution during FFF process of ST and CT specimens for experiment and simulation.
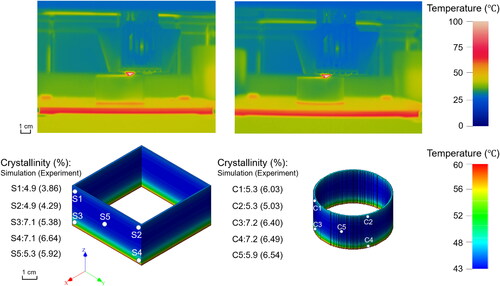
Figure 7. Stress distribution in (a) ST and (b) CT specimens.
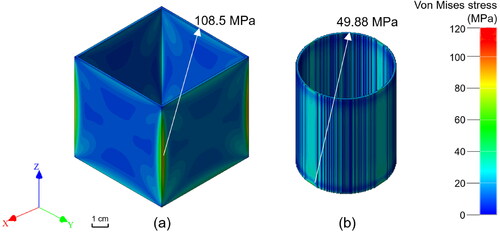
Figure 8. The perfect geometric status of (a) ST and (b) CT specimens, and the 100 times magnified out-of-plane warpage deformations of additively manufactured (c) ST and (d) CT specimens, and a schematic to exhibit the warpage measurement baselines along the height direction (Z axis).
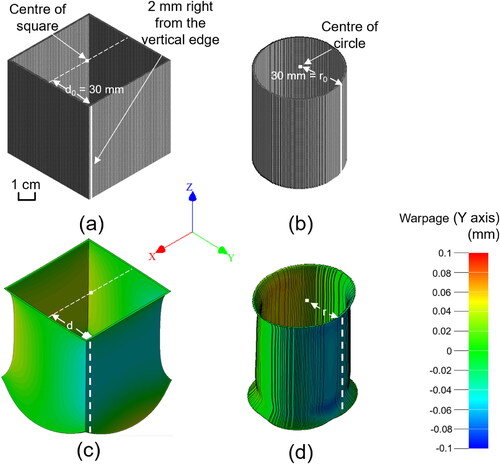
Figure 9. The warpage along the measurement baseline (Z axis) from bottom to upper direction of (a) ST and (b) CT specimens by simulation and experiments.
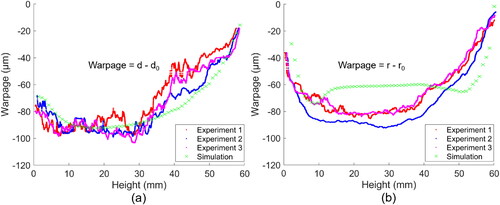
Figure 10. Cauchy stress XX of (a) ST and (b) CT specimens and Cauchy stress YY of (c) ST and (d) CT specimens.
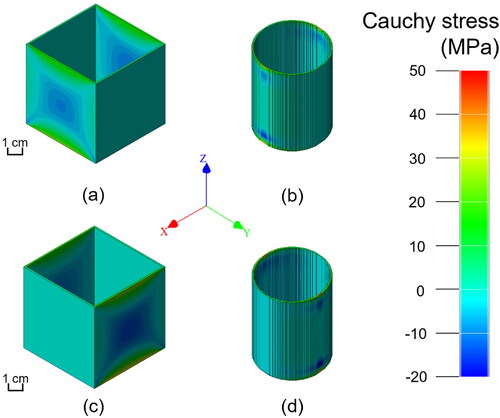
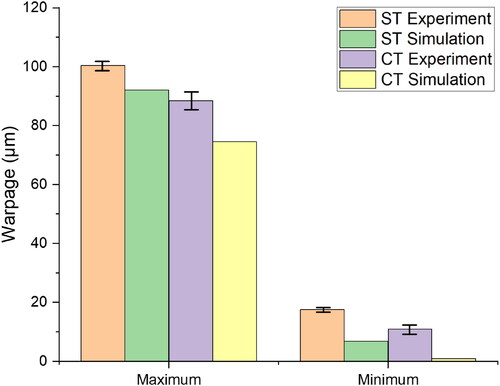
Figure 11. A comparative study for the maximum and minimum warpages of ST and CT specimens acquired by both experiments and simulation.
Data availability statement
The data that support the findings of this study are available from the corresponding authors, Yuan Chen and Lin Ye, upon reasonable request.