Figures & data
Figure 1. Location map of the study area.
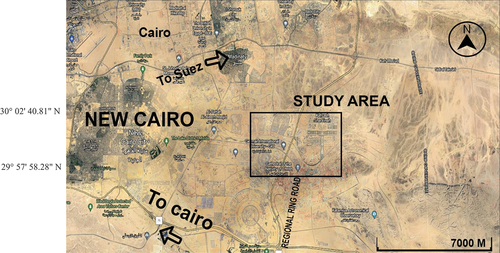
Figure 2. Simplified regional geological map of the New capital city and its neighbouring.
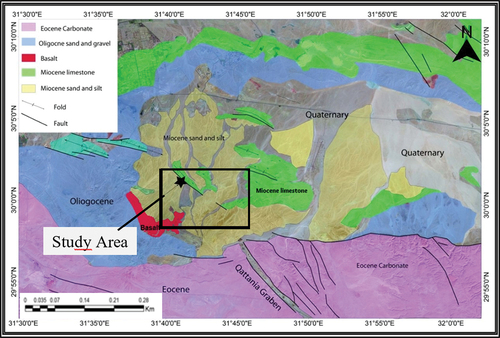
Figure 3. Generalized stratigraphic column of the study area (modified after Moustafa and Abd‐Allah Citation1991).
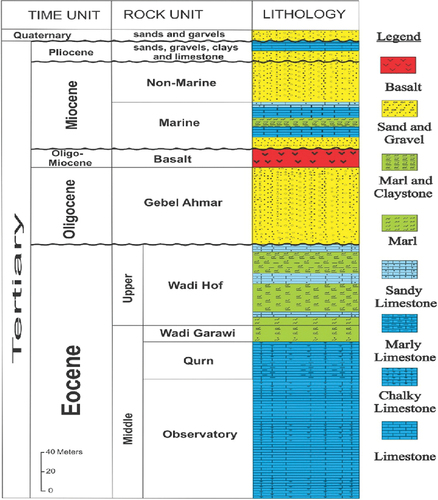
Figure 4. Location map showing the conducted 16 ERT profiles at the study area.
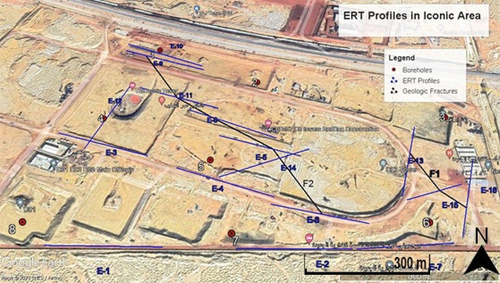
Figure 5. Subdivision of the subsurface into rectangular blocks to interpret the data from 2-D imaging survey using different algorithms.
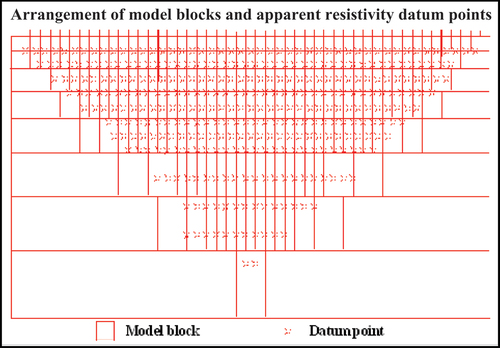
Figure 6. Electrical resistivity tomography of profile no. 5.
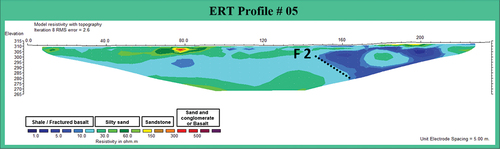
Figure 7. Electrical resistivity tomography of profile no. 6.
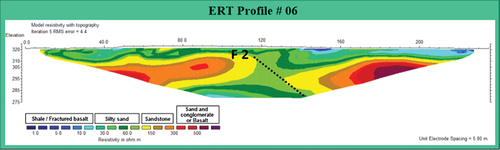
Figure 8. Electrical resistivity tomography of profile no. 8.
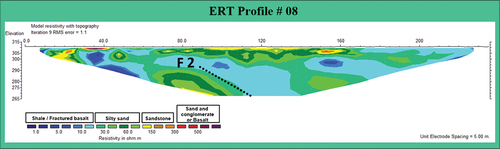
Figure 9. Electrical resistivity tomography of profile no. 9.
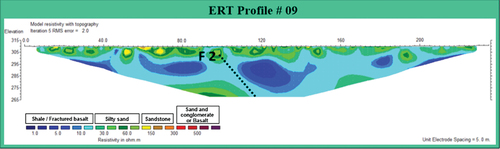
Figure 10. Electrical resistivity tomography of profile no. 11.
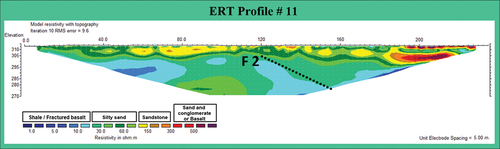
Figure 11. Electrical resistivity tomography of profile no. 13 (above), geological cross section that is correlated with ERT profile (below).
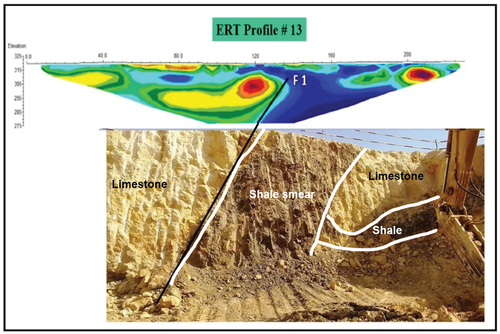
Figure 12. Electrical resistivity tomography of profile no. 15.
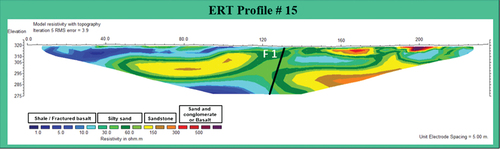
Figure 13. Electrical resistivity tomography of profile no. 16.
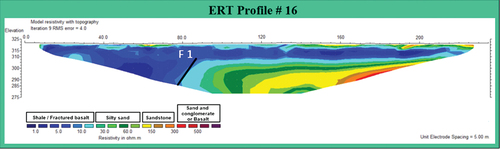
Figure 14. Location map showing the 12 VLF profiles at the study area.
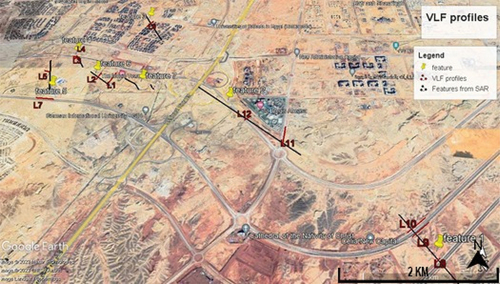
Figure 15. Plot showing the current density cross section along profile 1 for observed data, the Fraser filter, and the tilt angle, representing the real component of the VLF data.
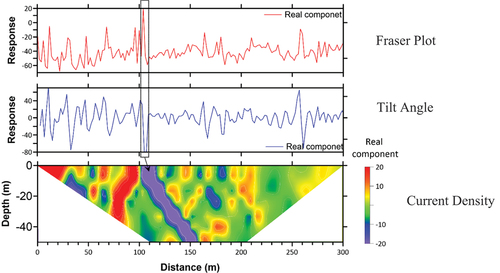
Figure 16. The current density cross sections along profile no. 2 to 12.
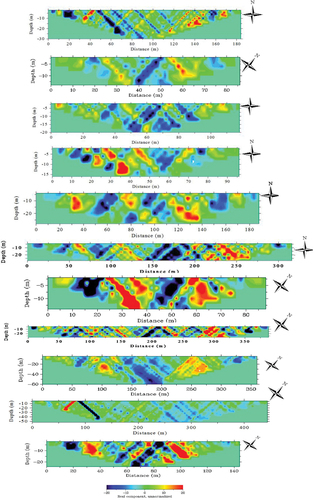
Figure 17. The aggregation of all of the cross-sections in the research region that were produced from the K-H filter, which represents the real component of the VLF data. The cross sections are not displayed in the right locations, which are represented on the associated Google earth map.
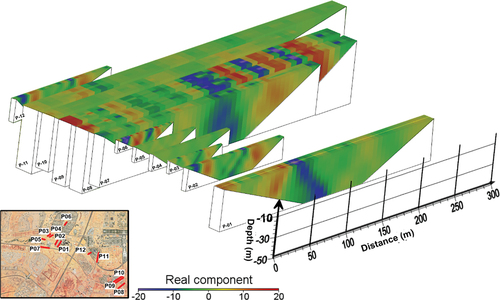
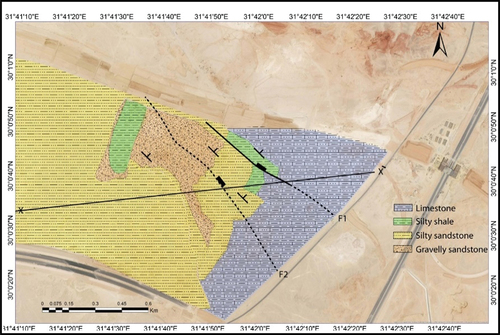
Figure 18. Geological map of the study area overlies Google earth image.