Figures & data
Figure 1. A map showing the research area’s location.
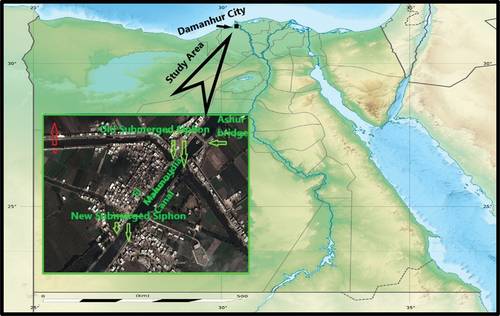
Figure 2. Eye bird view of the study region with the chosen GPR profiles.
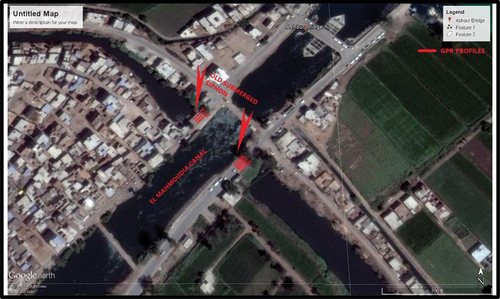
Figure 3. The northeastern shoulder of the submerged Syphon’s body. There are some distortions and devastated areas.
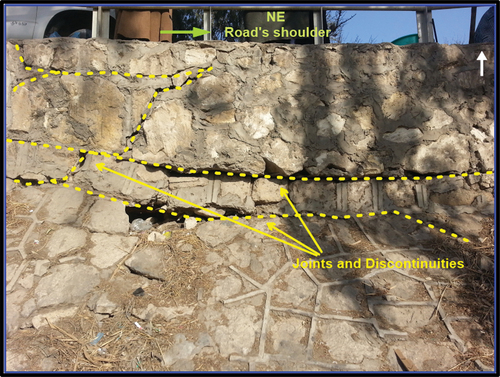
Figure 4. The asphaltic road partially falls on the southwestern shoulder of the submerged Syphon’s body.
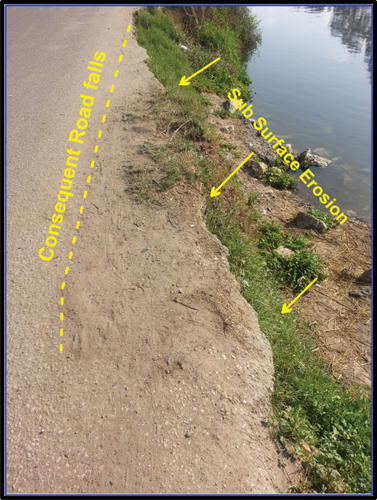
Figure 5. GPR diagram from the website of Environmental Protection Agency, website.
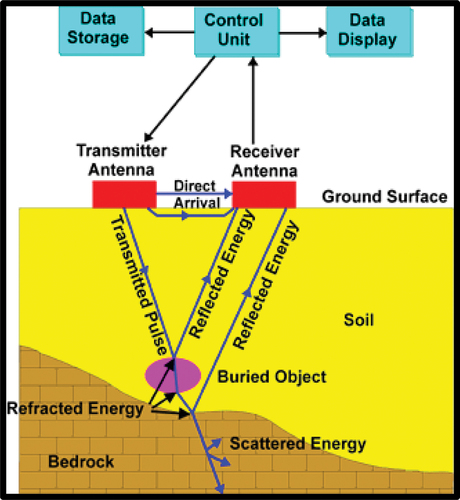
Figure 6. The GPR profiles directions over the submerged Syphon and the locations of the distortion places.
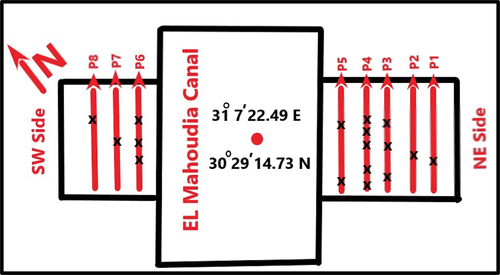
Figure 7. The GPR profile (P1) shows some distortions on the left side of the submerged Syphon (distance of 9 m and depth of about 4 m).
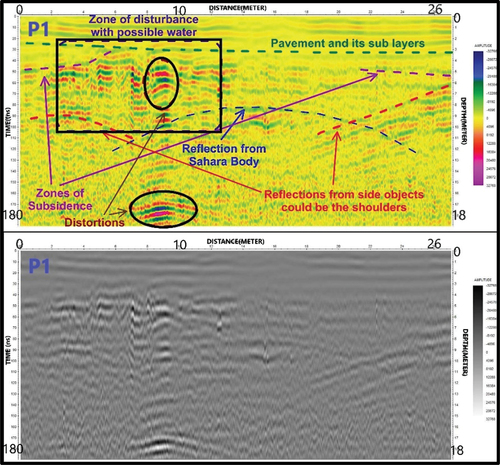
Figure 8. The GPR profile (P2) shows almost all the features (distortions) that have been observed in profile P1.
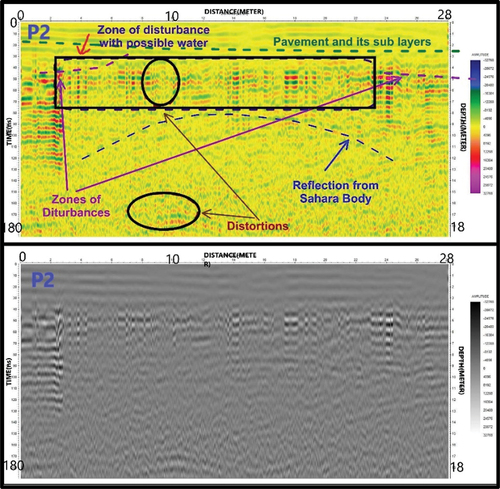
Figure 9. The GPR profile (P3) shows distortions which are bounded by circles.
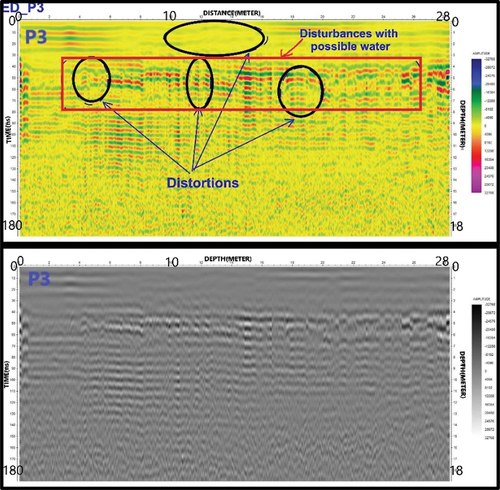
Figure 10. The GPR profile (P4) shows the existence of water-saturated and disturbances features.
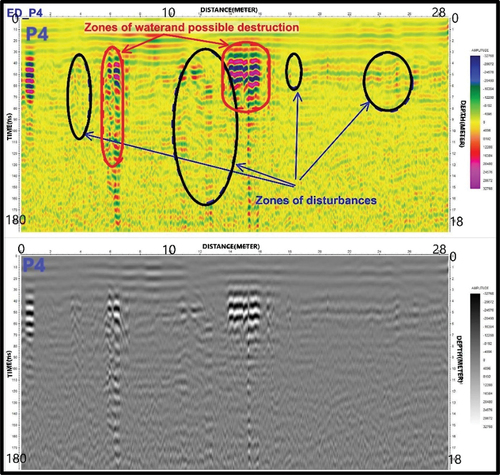
Figure 11. The GPR profile (P5). It shows zones of water-saturated possible destruction.
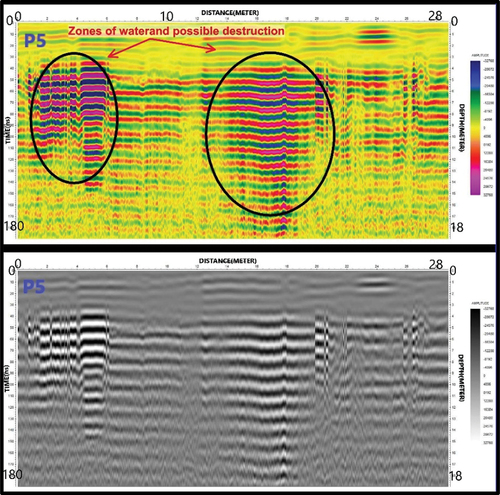
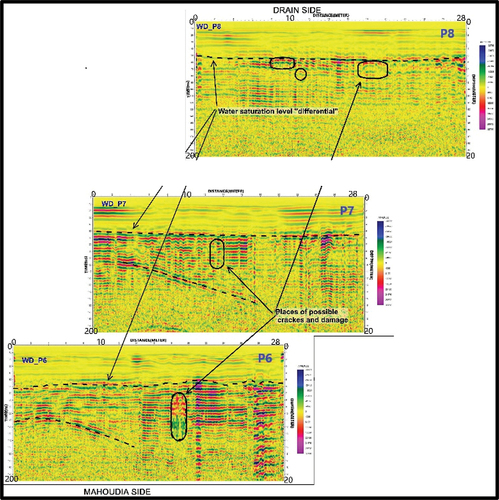
Figure 12. GPR profiles (P6, P7, and P8) are displayed. They show the places of possible cracks and damage.