Figures & data
Figure 1. Location of the selected riparian buffer and its corresponding riverway in the Menchenghu city plain section of the Yongding river in Mentougou district of Beijing: (a) Beijing; (b) city plain section of the Yongding river in Beijing; and (c) selected riparian buffer and its corresponding riverway.
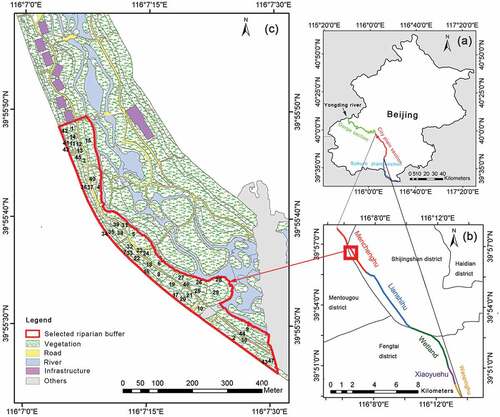
Table 1. Thermal category thresholds of thermal humidity index (THI), land surface temperature (LST), and modified thermal humidity index (MTHI).
Figure 2. Modified thermal humidity index (MTHI) ranges and the corresponding human thermal comfort levels.
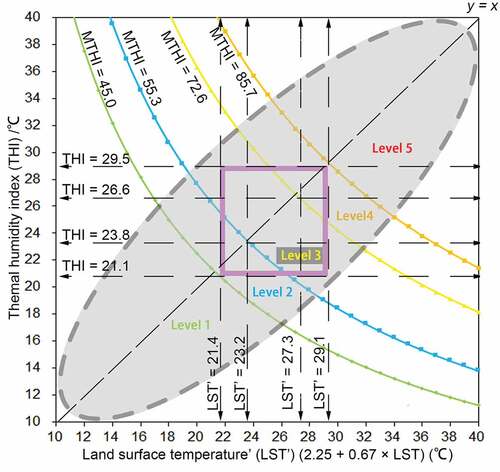
Figure 3. Methods to validate the estimated modified thermal humidity index (MTHI). Significance: ***p < 0.001.
Figure 4. Comparisons between the estimated modified thermal humidity index (MTHI) and estimated (HTCm1 (a), HTCm2 (b), HTCm3 (c), HTCm4 (d), and HTCm5 (e)) and perceived human thermal comfort (HTCs (f)). The relationships are also compared between MTHI and THI.
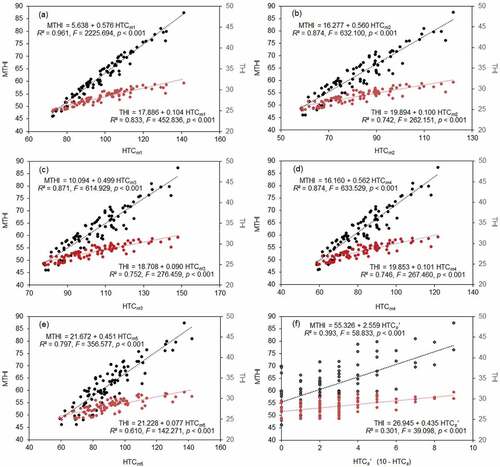
Figure 5. Daytime variations in measured microclimate indices and calculated thermal humidity indices for vegetation patches and roads in the study riparian buffer in July and August. The values at each time were from the mean measured or estimated data for the 47 vegetation patches, each having 18 (for T, RH, and THI) or 6 (for LST and MTHI) repeated measurements. Standard deviation bars are also provided.
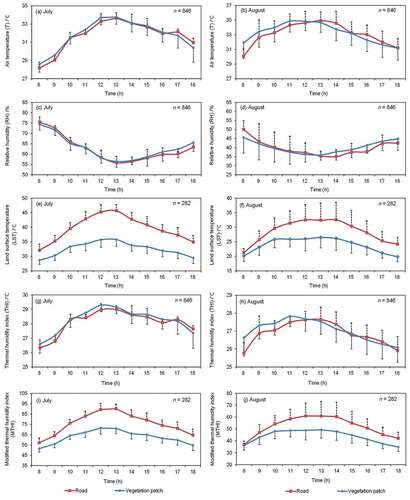
Figure 6. Area portions of different human thermal comfort (HTC) levels at the daytime for the vegetation patches in the study riparian buffer in July (a), August (b), and September (c).
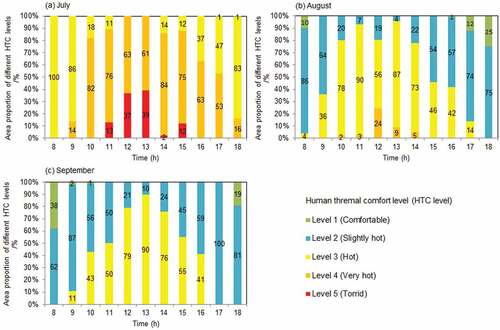
Figure 7. Estimated mean daytime modified thermal humidity index (MTHI) over the study subarea.
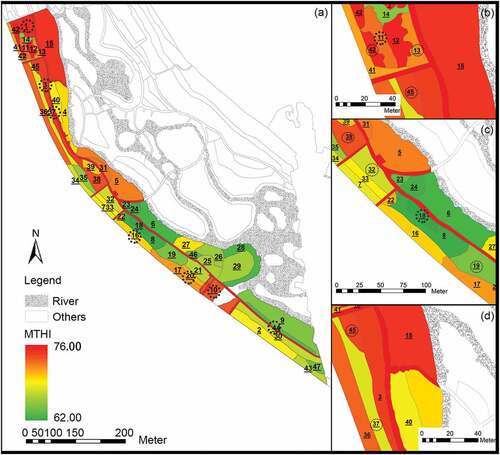
Figure 8. Redundancy analysis between microclimate indices and patch indices.
Figure 9. Comparisons of structure indices and their effects on modified thermal humidity index (MTHI) between different patches.