
Figures & data
Figure 1. Sampling sites in Yalu River Estuary, China.
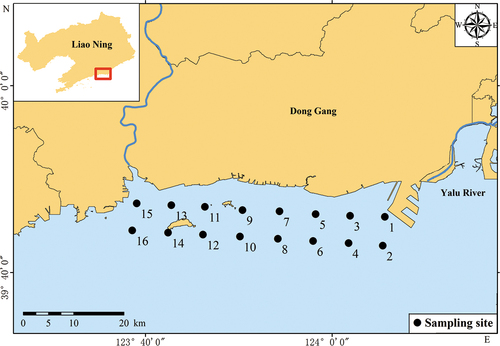
Figure 2. (a) Relative abundance of phytoplankton composition (Phylum) from March to December; (b) Relative abundance of phytoplankton composition (Phylum) in all four seasons in Yalu River Estuary, China.
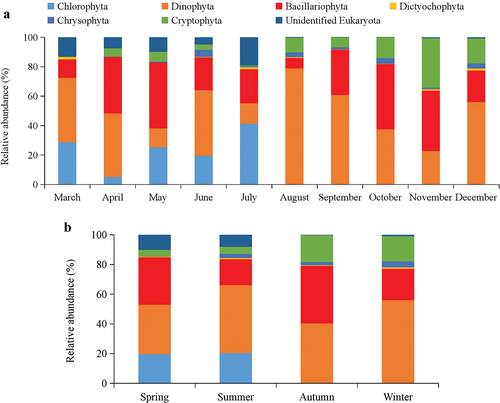
Table 1. Dominant species of phytoplankton in Yalu River Estuary, China, from March to December 2020.
Figure 3. Proportions of different size-fractioned phytoplankton in monthly changes (a) and in all four seasons (b).
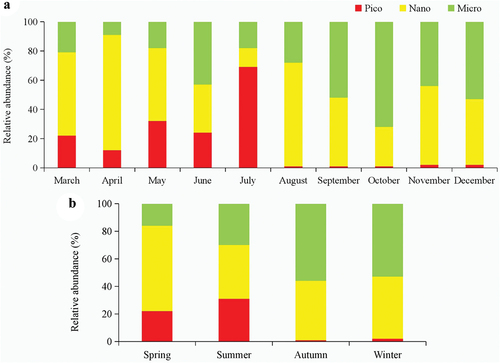
Figure 4. Distribution of different size-fractioned phytoplankton biomass in Yalu River Estuary, China.
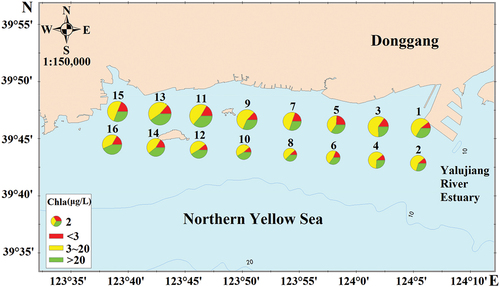
Table 2. Means of the various environmental parameters from each cruise measured in the Yalu River Estuary, China, in 2020.
Figure 5. PCA analysis of correlation between stations/months and environmental factors in Yalu River Estuary, China. (a: spring; b: summer; c: autumn; d: winter; e: station average; f: monthly average; 1–16 in Fig (A-E) represent 16 stations;3–12 in Fig (F) represent March to December).
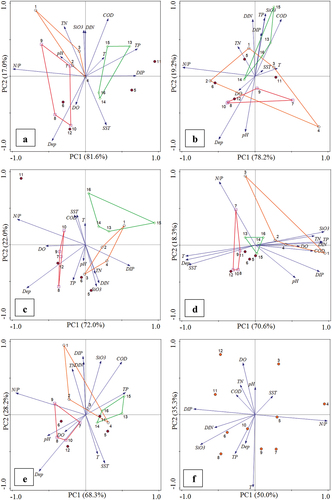
Figure 6. RDA analysis of correlation between phytoplankton and environmental factors in Yalu River Estuary, China. (a: spring; b: summer; c: autumn; d: winter; e: station average (the average value of the content of relevant environmental factors and the number of phytoplankton sequences from March to December corresponding to the 16 stations); f: monthly average (the average value of the relevant environmental factors and microalgae sequence numbers of 16 stations in each month from March to December); Blue arrow: phytoplankton; red arrow: each environmental factor). The cosine of the angle between the red arrow and the blue arrow represents the correlation between the environmental variable and the phytoplankton biomass. Explanatory quantity and significance test of environmental factors are shown in . The abbreviation codes of phytoplankton species are shown in Table S1. Means of the various environmental parameters from each month measured in the Yalu River Estuary, China, in 2020 are shown in Table S2.
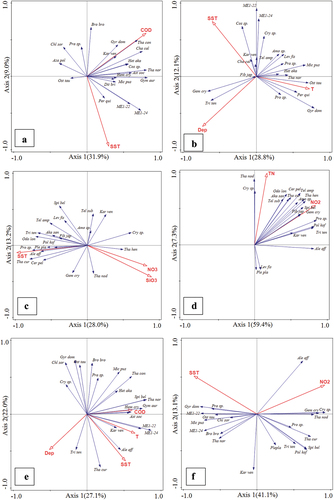
Table 3. Explanatory quantity and significance test of environmental factors.