Figures & data
Table 1. Exposure period, target species, and environmental conditions during the experiment at the free-air O3 eXposure (FO3X). n.A. denotes not available. Ambient O3 concentration (AA), 1.2 times ambient concentration (1.2×AA), 1.4 times ambient concentration (1.4×AA), 1.5 times ambient concentration (1.5×AA) and twice ambient concentration (2.0×AA).
Table 2. Site information of the 17 monitoring ozone injury for seTttting new critical LevelS (MOTTLES) sites in France, Italy and Romania. Daily mean air temperature (T), Daily mean solar radiation (RAD), Daily mean relative humidity (RH), Annual total precipitation (Prep.) and Hourly mean ozone concentration (O3) are calculated from 2017 to 2021 for Italian sites and from 2017 to 2019 for France and Romania (± standard deviation).
Figure 1. Examples of ozone visible foliar injury (O3 VFI) from Monitoring Ozone injury for seTTtting new critical LevelS (MOTTLES) sites and the Free-air O3 eXposure (FO3X), A and G) Homogeneously distributed interveinal reddish (Rd); B, C, F, H and I) Reddish interveinal stippling (RdSt); D, K and L) Dark brownish interveinal stippling (BrwSt); E and J) Chlorosis (Cl). K and L) Homogeneously distributed interveinal brownish (Brw); C, F) Bronzing (Br).
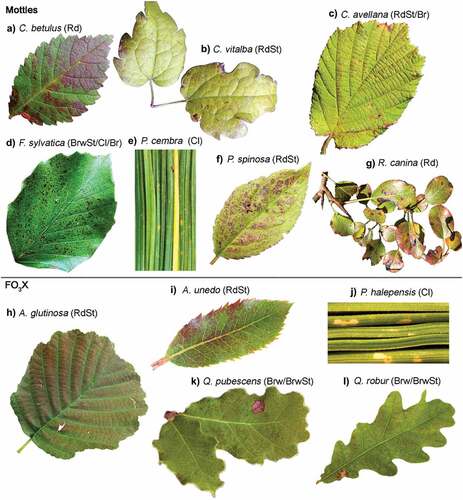
Table 3. Species showing ozone-induced visible foliar injury (O3 VFI) at the MOTTLES (Monitoring Ozone injury for seTttting new critical LevelS) sites (ITP – in the plot and LESS - Light Exposed Sampling Site) in France (FR), Italy (IT) and Romania (RO) or from the Free-air O3 eXposure (FO3X). O3-induced visible foliar injury (O3 VFI) classifies as homogeneously distributed interveinal reddish (Rd), Reddish interveinal stippling (RdSt), Homogeneously distributed interveinal brownish (Brw), Dark brownish interveinal stippling (BrwSt), chlorosis (Cl) and Bronzing (Br). Leaf habit (evergreen [Ev]/deciduous [De], conifer [C]/broadleaf [Br].
Figure 2. Visual results of the selected linear model for the percentage of symptomatic species within the Light Exposed Sampling Site – LESS (symptomatic_sps) presented in table 3. Significant effects on symptomatic_sps determined by a) by the total number of species in the LESS (SR_LESS) plotted as linear regression with confidence interval and b) by the Country (FR, France; IT, Italy; RO, Romania) plotted as violin box plot.
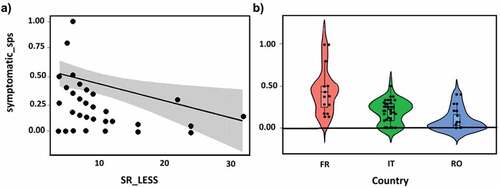
Figure 3. Visual results of the selected linear model for the percentage of ozone visible foliar injury (O3_VFI) per plot, presented in table 3. Significant effect on O3_VFI determined by the total number of species in the Light Exposed Sampling Site – LESS (SR_LESS) plotted as linear regression with confidence interval.
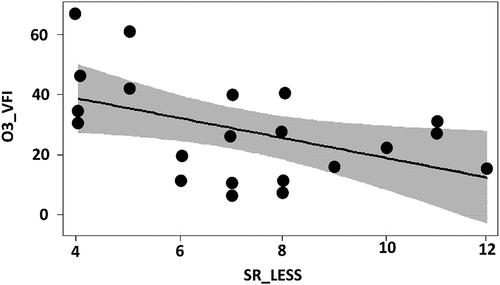
Table 4. Optimal linear model structures relating the percentage of symptomatic species (symptomatic_sp) over the LESS (Light Exposed Sampling Site) and the percentage of ozone visible foliar injury (O3 VFI) in the plot (ITP). Response variables to the total number of species in the LESS (SR_LESS), the country, and the year [R syntax of the starting model: y ~ SR_LESS * year * country * elevation * aspect * dominant species * biogeographical region]. Values for the predictor variables: SR_LESS, country (level Italy and Romania compared with France), are parameter estimates. R2 refers to the fraction of the variation explained by the model structure, and R2 adjusted takes into account the number of independent variables used for predicting the target variable.
Table 5. Onset of ozone visible foliar injury (O3 VFI) at the Free-air O3 eXposure (FO3X). Ambient O3 concentration (AA), 1.2 times ambient concentration (1.2×AA), 1.4 times ambient concentration (1.4×AA), 1.5 times ambient concentration (1.5×AA) and twice ambient concentration (2.0×AA).
Figure 4. Examples of color composition in adaxial leaf blades with ozone visible foliar injury (O3 VFI) from Monitoring Ozone injury for seTTtting new critical LevelS (MOTTLES) sites and the Free-air O3 eXposure (FO3X), A and C) Homogeneously distributed interveinal reddish (Rd); B and C) Reddish interveinal stippling (RdSt) B) Dark brownish interveinal stippling (BrwSt) and Homogeneously distributed interveinal brownish (Brw). Colors better describing the O3 VFI (O3 VFI/Color) or Leaf typical chlorophyll pigments (LTCP).
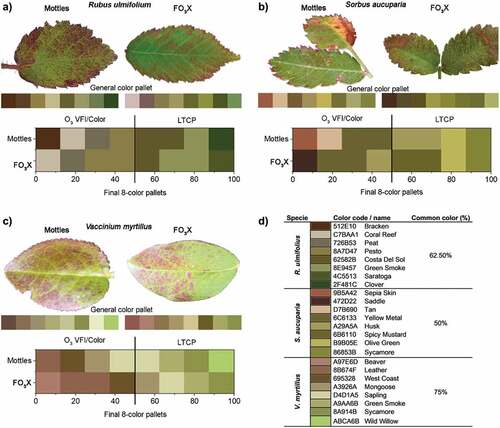
Table 6. Phytotoxic Ozone Dose (POD1) and accumulated exposure over a threshold of 40 ppb (AOT40) values corresponding to the occurrence of the O3 visible foliar injury (O3 VFI) onset at the Free-air O3 eXposure (FO3X).
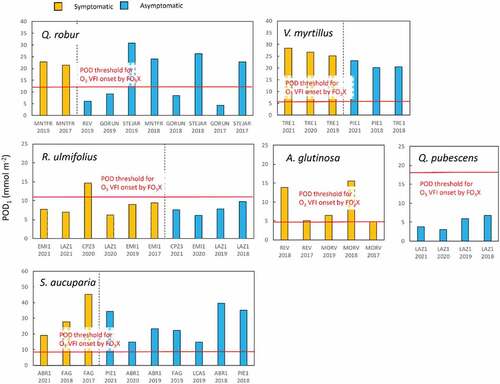
Figure 5. Phytotoxic Ozone Dose (POD1) and the presence or absence of ozone visible foliar injury (O3 VFI) for several forest species in Monitoring Ozone injury for seTTtting new critical LevelS (MOTTLES) sites. Both in the plot (ITP) and Light Exposed Sampling Site (LESS) data were considered. Red line shows the POD1 threshold for the onset of O3 VFI obtained from the Free-air O3 eXposure (FO3X) experiments (see Table 6 for a detail).