Figures & data
Figure 1. Culturable fungi in six Tibetan Plateau lakes. (a) Phylogenetic tree of all strains obtained in six lakes based on ITS sequences. (b) The number of fungal genera, species, and strains in different phyla obtained in this study. (c) Number of strains of the top 20 genera with the highest frequency of isolation and their corresponding number of species. (d) The number of species with less than 98% and 99% ITS sequence similarity to known species in the NCBI database.
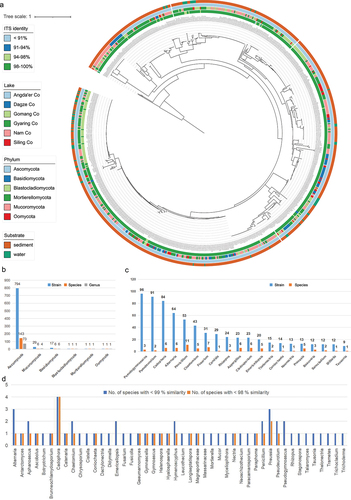
Figure 2. Alternaria xizangensis (from ex-holotype CGMCC 3.27272). (a–b) Surface and reverse of the colony on PDA. (c–d) Surface and reverse of the colony on OA. (e–f) Surface and reverse of the colony on MEA. (g–j) Conidiophores and conidia. Scale bars: g–j = 10 µm.
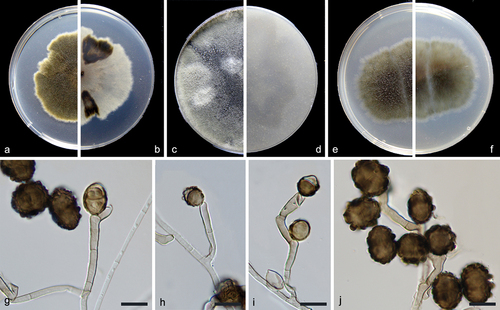
Figure 3. Maximum likelihood (ML) tree of Alternaria sect. Ulocladioides based on ITS, LSU, SSU, gapdh, rpb2, and tef1-α sequences. The tree is rooted with A. alternariae (CBS 126989). The tree topology of the ML analysis was similar to the BI. ML bootstrap values (≥50%) and Bayesian posterior probability (≥0.9) are indicated along branches (ML/PP). Novel species are in bold font and “T” indicates type derived sequences.
Figure 4. Emericellopsis ovoidea (from ex-holotype CGMCC 3.27273). (a–b) Surface and reverse of the colony on PDA. (c–d) Surface and reverse of the colony on OA. (e–f) Surface and reverse of the colony on MEA. (g–j) Conidiogenous cells and conidia. (k) Conidia. Scale bars: g–k = 10 µm.
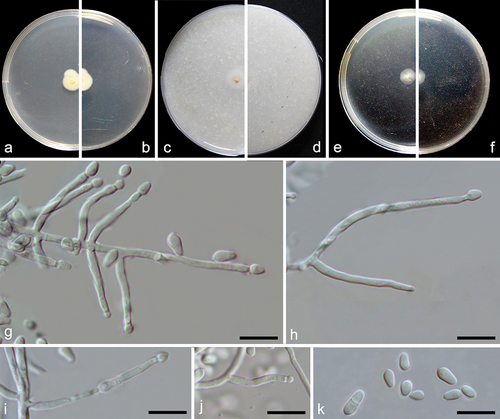
Figure 5. Maximum likelihood (ML) tree of Emericellopsis and allied genera based on ITS, LSU, rpb2, and tef1-α sequences. The tree is rooted with Stanjemonium ochroroseum (CBS 656.79). Tree topology of the ML analysis was similar to the BI. ML bootstrap values (≥50%) and Bayesian posterior probability (≥0.9) are indicated along branches (ML/PP). Novel species are in bold font and “T” indicates type derived sequences.
Figure 6. Myceliophthora xizangica (from ex-holotype CGMCC 3.27275). (a–c) Surface of colonies on PDA, OA, and MEA, respectively. (d–g) Conidiophores and conidia. (h) Conidia. Scale bars: d–h = 10 µm.
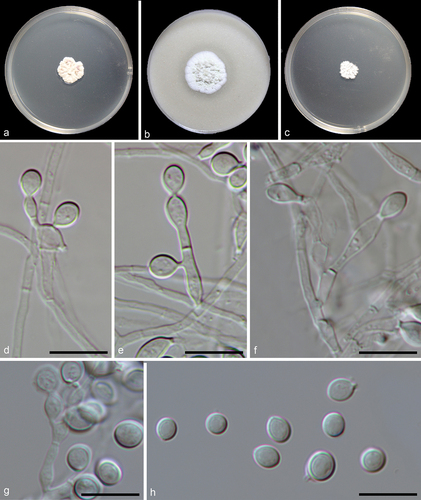
Figure 7. Maximum likelihood (ML) tree of Myceliophthora and allied genera based on ITS, rpb2, and tef1-α sequences. The tree is rooted with Allobotryotrichum blastospora (LC11913). Tree topology of the ML analysis was similar to the BI. ML bootstrap values (≥50%) and Bayesian posterior probability (≥0.9) are indicated along branches (ML/PP). Novel species are in bold font and “T” indicates type derived sequences.
Figure 8. Preussia cylindricalis (from ex-holotype CGMCC 3.27271). (a–b) Surface and reverse of the colony on PDA. (c–d) Surface and reverse of the colony on OA. (e–f) Surface and reverse of the colony on MEA. (g) Pycnidium. (h–j) Conidiogenous cells and conidia. (k) Conidia. Scale bars: g = 25 µm; h–k = 10 µm.
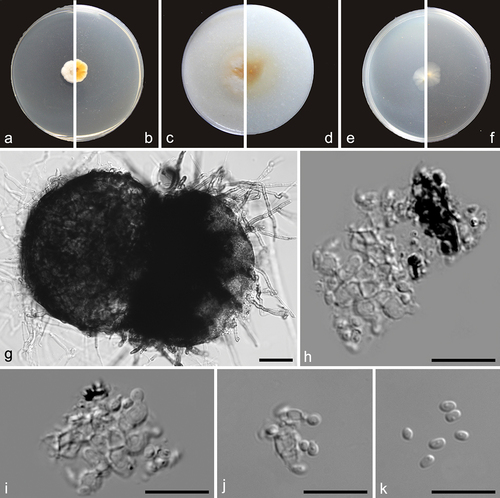
Figure 9. Maximum likelihood (ML) tree of Preussia and allied genera based on ITS and LSU sequences. The tree is rooted with Westerdykella angulata (CBS 610.74). Tree topology of the ML analysis was similar to the BI. ML bootstrap values (≥50%) and Bayesian posterior probability (≥0.9) are indicated along branches (ML/PP). Novel species are in bold font and “T” indicates type derived sequences.
Figure 10. Preussia sedimenticola (from ex-holotype CGMCC 3.27276). (a–b) Surface and reverse colony on PDA. (c–g) Conidiogenous cells and conidia. (h) Conidia. Scale bars: c–h = 10 µm.
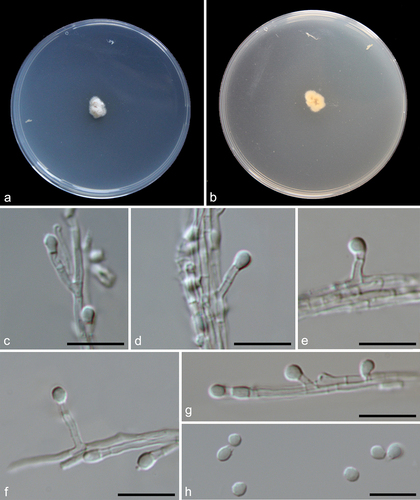
Figure 11. Pseudeurotium desertorum (a, d–g from LC19441; b–c, h–k from LC19712). (a–c) Colonies on PDA, OA, and MEA. (d–f) Conidiogenous cells and conidia. (g) Conidia. (h–j) Asci and ascospores. (k) Ascospores. Scale bars: d–k = 10 µm.
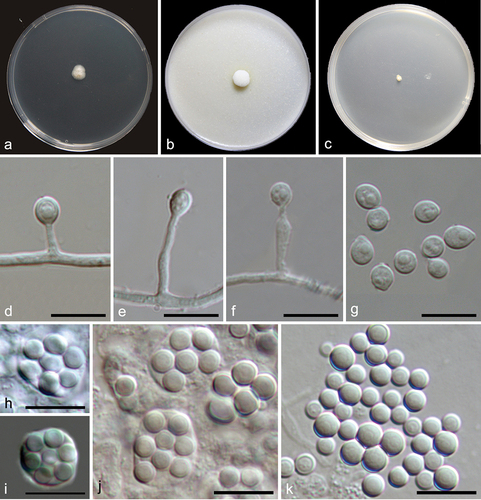
Figure 12. Maximum likelihood (ML) tree of Pseudeurotium based on ITS sequences. The tree topology of the ML analysis was similar to the BI. ML bootstrap values (≥50%) and Bayesian posterior probability (≥0.9) are indicated along branches (ML/PP). “T” indicates type-derived sequences.
Figure 13. Pseudeurotium sedimenticola (from holotype HMAS 352882). (a–b) Surface and reverse of the colony on PDA. (c–h) Conidiophore and conidia. Scale bars: c–h = 10 µm.
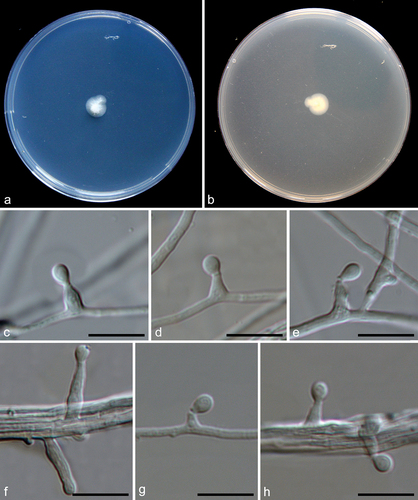
Figure 14. Xizangia sedimenticola (from ex-holotype CGMCC 3.27274). (a) Surface of the colony on OA. (b–d) Conidiophores and conidia. (e–g) Conidia. Scale bars: b–g = 10 µm.
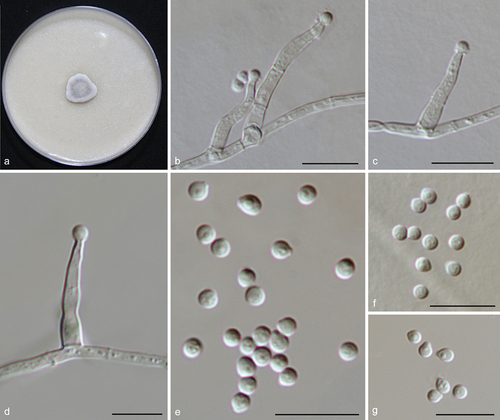
Figure 15. Phylogenetic tree resulting from maximum likelihood (ML) analysis of the concatenated partial rpb2, tub2, ITS, and LSU gene region alignment. Tree topology of the ML analysis was similar to the BI. ML bootstrap values (≥50%) and Bayesian posterior probability (≥0.9) are indicated along branches (ML/PP). Type strains are marked with “T” (type), “ET” (epitype) or “NT” (neotype) after the culture number. The scale bar shows the expected number of changes per site.