
Figures & data
Table 1. Binding energy from the docking analysis of 3 polypeptide antibiotics with S-protein of SARS-CoV-2 and several virus variants.
Figure 1. The docking profiling of the binding complex of antibiotics with S-protein of SARS-CoV-2 and Omicron variant (B1.1.529). (a). Binding docking of DAP with the WT S-protein. DAP is located in the cavity near the Cys379 site of S-protein. (b). Docking of DAP binding with Omicron (B1.1.529) S-protein. DAP is located near the Asn135 of Omicron (B1.1.529) S-protein and close to the RBD region of the S1 subunit. (c). Docking of VAN binding with WT S-protein. VAN is located in the RBD region of WT S-protein. (d). Docking of VAN binding with Omicron (B1.1.529) S-protein. VAN is located in the RBD region of Omicron (B1.1.529) S-protein. (e-f). Chemical structure of DAP (e) and VAN (f). The S-protein is a trimeric protein, the blue, red, and green part of the figure represents different monomers respectively. The white arrow represents the antibiotics, and the yellow section represents amino acids on the S-protein at the binding site. DAP: daptomycin, VAN: vancomycin. WT: SARS-CoV-2 original strain.
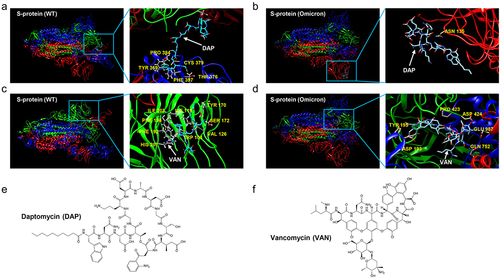
Figure 2. S-protein-containing PsV production procedure and PsV invasion efficiency on several cell lines. (a). S-protein-containing PsV construction procedure. The gene of GFP was inserted into the plasmid pNL4–3-Luc-R-E to construct a helper packaging plasmid named pNL4–3-GFP-Luc-R-E, which included CMV promoter, GFP and luciferase. The expression plasmid pcDNA3.1-Omicron/S and the packaging plasmid pNL4–3-GFP-Luc-R-E were co-transfected into HEK-293T cells at a ratio of 1:4 to incubate 48h, then the culture medium supernatant was collected to filter by 0.45μm filter membrane, and centrifuged at 72,000×g for 2h at 4℃ to obtain the PsV precipitate. The PsV precipitate was resuspended in fresh medium to determine PsV titers. Finally, 1 × 10⁷ TU/mL PsV was stored at−80℃ for further use. (b). DAP influences on cell viability of Vero-E6, Huh-7 and HEK-293T-hACE2 at different concentrations. (c). VAN influences on cell viability of Vero-E6, Huh-7, and HEK-293T-hACE2 at different concentrations. (d). Invasion efficiency of PsV on Vero-E6, Huh-7 and HEK-293T-hACE2 cells. 6 × 10³ cells from each group were collected for luciferase activity assay, and the result was expressed as the relative light unit (RLU). A two-tailed unpaired Student’s t test was used to determine the differences between two independent groups, data were presented as the means±SEM (***, p < 0.001). The experiments were repeated for three times.
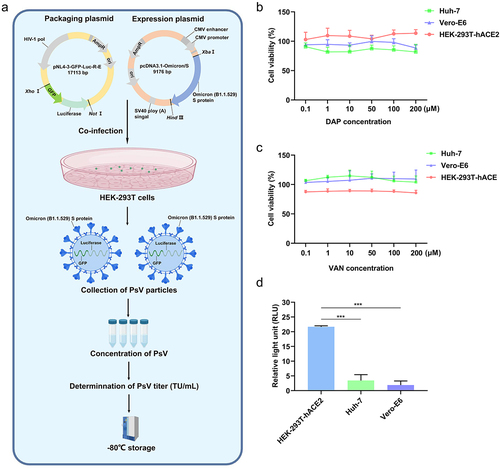
Figure 3. PsV invasion to HEK-293T-hACE2 cells with antibiotics co-operation. (a). Schematic diagram of PsV invasion under antibiotics incubation. After 2 × 10⁴ HEK-293T-hACE2 cells per well were seeded in a 96-well plate to culture 24h, 100μM DAP or VAN was respectively incubated with 5 × 10⁵ TU/mL PsV on ice for 1h, and then 150μL of the mixture was added to HEK-293T-hACE2 cells per well for incubation of 6h at 37°C, the supernatant was removed and replaced with new DMEM medium for culture 48h. Finally, from totally collected cells, the proportion of GFP-tagging cell quantity and the luciferase activity were determined to evaluate infection efficiency of PsV on HEK-293T-hACE2. (b). Fluorescence imaging of the PsV invasion cells. The number of cells expressing GFP protein was directly observed by high magnification microscope (20×) after PsV infection for 48h. (c). The relative percent of GFP-positive host cells in the PsV invasion assay. After 48h of cell culture, the proportion of GFP-expressing cells in each group was counted on the cell counter. 4 × 10³ cells were collected and added to the wells of the counter plate, and the proportion of GFP-positive cells was analyzed using the fluorescent cell counting mode of the cell counter. (d). Luciferase activity was measured in the PsV invasion assay. After 48h of cell culture, 1.2 × 10⁵ cells from each group were collected for luciferase activity assay, and the result was expressed as the relative light unit (RLU). (e). Comparison of invasion efficiency of PsV under different incubation concentrations of DAP. 6 × 10³ cells from each group were collected for luciferase activity assay to evaluate influence of different concentrations of DAP on the invasion efficiency of PsV, and the result was expressed as the relative light unit (RLU). A two-tailed unpaired Student’s t test was used to determine the differences between two independent groups, data were presented as the means±SEM (***, p < 0.001); ns, p > 0.05). The experiments were repeated for three times.
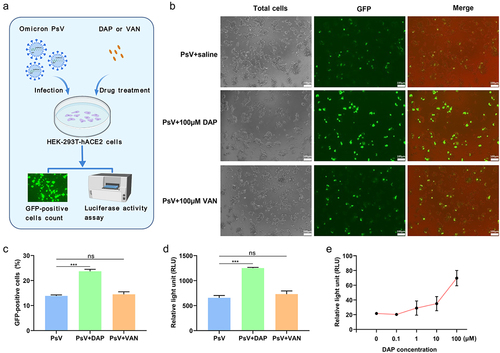
Figure 4. DAP promotes PsV invasion under co-operation with Ca2+. (a). Schematic diagram of PsV invasion under DAP incubation in Ca2+-free or Ca2+-containing medium. 2 ×10⁴ HEK-293T-hACE2 cells were seeded in 96-well plates to culture with normal DMEM medium for 24h at 37°C, and sterile saline was added to gently wash three times, then 200μL of Ca2+-free DMEM or Ca2+-containing DMEM was added to each well, respectively. The cells were divided into five groups: Ca2+-free DMEM+saline group, Ca2+-free DMEM+PsV group (5 × 10⁵ TU/mL), Ca2+-free DMEM+PsV (5 × 10⁵ TU/mL)+DAP (100μM) group, Ca2+-containing DMEM+PsV group (5 × 10⁵ TU/mL), and Ca2+-containing DMEM +PsV (5 × 10⁵ TU/mL)+DAP (100μM) group. The PsV solution and DAP were added according to the grouping as described above, cultured for 6h, and then replaced with fresh medium for culturing another 48h. (b). Luciferase activity was measured to compare the PsV invasion efficiency. 6 × 10³ cells from each group were collected for luciferase activity assay to assess the invasion efficiency of the PsV, and the result was expressed as the relative light unit (RLU). (c). Fluorescence imaging of PsV invasion. The number of GFP-expressing cells was directly observed by high magnification microscope (20×) after PsV infection for 48h. A two-tailed unpaired Student’s t test was used to determine the differences between two independent groups, data were presented as the means±SEM (****, p < 0.0001). The experiments were repeated for three times.
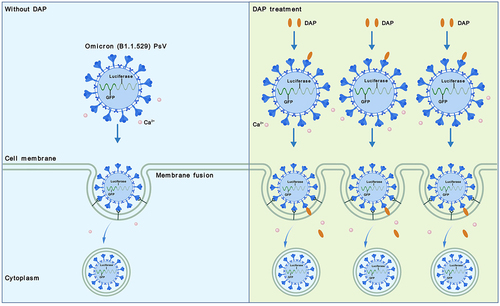
Figure 5. Schematic summary of PsV invasion to cells under DAP co-operation. Compared to the infection efficiency of PsV alone (the left), the cell number of PsV invasion was increased when DAP was supplemented to Ca2+-containing cell medium (the right). DAP interacts with S-protein of the PsV, then inserts to host cell membrane and promotes invasion of PsV.
Data Availability statement
The data presented in this study are available on request from the corresponding author.