
Figures & data
Table 1. Primers for PCR used in the present study.
Figure 1. Characterization of recombinant plasmids and recombinant protein His-YidR. (a–c) Schematic representation of pEt28a-YidR (a), pVAX1-YidR (b), and pVAX1-IL-17 (c) plasmids. (d) Expression of His-YidR were detected by coomassie-stained SDS-PAGE gels. M, protein marker; 1, total bacterial proteins in E. coli BL21 (DE3) containing pET-28a plasmid; 2–6, the E. coli BL21 (DE3) containing pEt28a-YidR was induced by IPTG at different concentration (0mM, 0.1mM, 0.5mM, 1.0mM, 2mM). (e) Purification of His-YidR were analyzed with Coomassie-stained SDS-PAGE gels. M, protein marker; 1, supernatant from whole-cell lysates; 2, flow-through solutions; 3–6, the recombinant protein His-YidR was purified by four concentrations of imidazole solutions (100mM, 200mM, 300mM, and 400mM). (f) The purified His-YidR was further concentrated by ultrafiltration device as shown in line 1. The position of the 49.5 kDa His-YidR band is pointed out by the arrow. (g) The separated proteins were transferred to polyvinylidene difluoride and detected by western blotting. 1, purified His-YidR; 2, control, total bacterial proteins in E. coli BL21 (DE3) containing pET-28a plasmid.
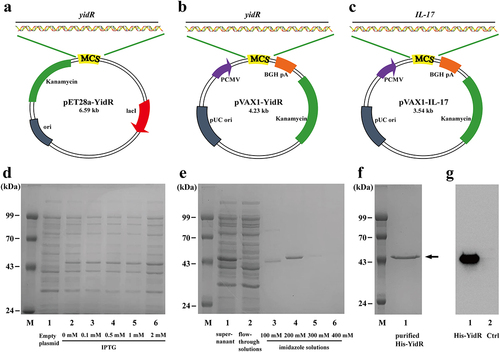
Figure 2. Transient expression of YidR and IL-17 in HEK293T cells by a confocal fluorescence microscopy. HEK293T cells were transfected with plasmid pVAX1 (a1–a3), p–IL17 (b1-b3), or p-YidR (c1–c3) for 36 h. Transient expression of proteins was detected with anti-His mouse monoclonal antibody. FITC: FITC-conjugated goat anti-mouse IgG; DAPI: cell nuclei; Merge: the overlay fluorescence images of FITC and DAPI; the scale bar is 20 µm.
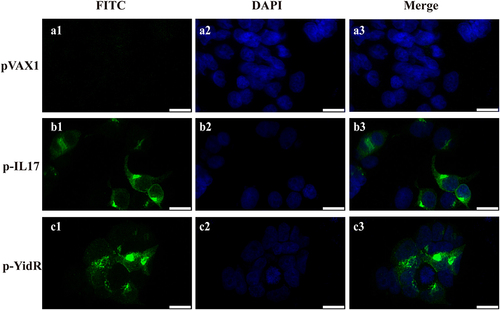
Figure 3. Vaccinations and Antibody responses elicited by the DNA vaccines. (a) Schematic illustrating the experimental timeline; KM mice were vaccinated or given PBS buffer, followed by infection with KPWT. Vaccinations are represented by the empty syringe; KPWT challenge is indicated with the black syringe. Mice were immunized with the DNA vaccines and boosted once at day 14 after primary immunization as described in methods. The anti-YidR IgG (b), IgG1 (c) and IgG2a (d) levels were detected at the indicated time point by an ELISA assay. (e) Dynamic changes of sera IgG2a/IgG1 against YidR in immunized mice. PBS was used as a control group. Data represented means ± SEM of three independent experiments. *p < 0.05, **p < 0.01, ***p < 0.001.
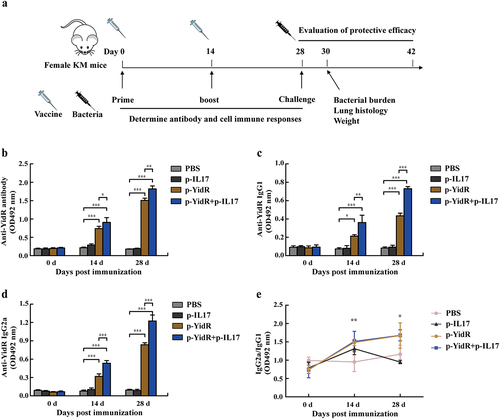
Figure 4. Proliferation of lymphocytes in spleens of mice immunized with the DNA vaccines. (a) The lymphocytes from the spleen of mice were separated and the proliferation of lymphocytes was detected by a CCK-8 assay. ConA indicates concanavalin A. (b–c) The CD4+ and CD8+ T lymphocytes were separated from the spleen and were sorted by flow cytometry at the indicated time points. Data represented means ± SEM of three independent experiments. *p < 0.05, **p < 0.01, ***p < 0.001.
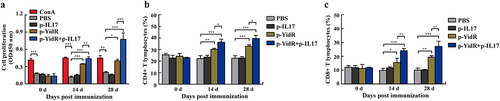
Figure 5. Assessment of cytokines from the suspension of the spleen lymphocytes. The spleen lymphocytes of immunized mice were harvested and were separated at the indicated time points as described above. The production levels of IL-2 (a), IFN-γ (b), and IL-4 (c) were determined by an ELISA assay. PBS was used as a control group. Data represented means ± SEM of three independent experiments. **p < 0.01, ***p < 0.001.
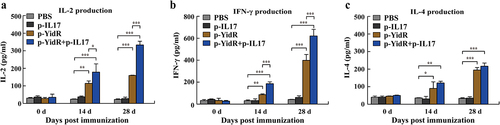
Figure 6. Residual CFUs and survival rate of mice challenged with K. pneumoniae. The mice were challenged at day 28 post immunization with KPWT strain to detect the residual bacteria of lungs (a) and BAL (b). Survival rate of mice was monitored for the subsequent 14 days (c). PBS was used as a control. *p < 0.05 and ***p < 0.001.
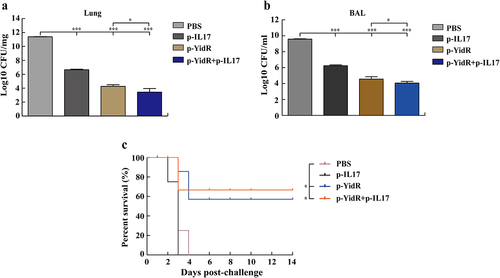
Figure 7. Histopathologic analysis of mice lungs challenged with K. pneumoniae. The mice were challenged at day 28 with KPWT strain as described above. The lungs of immunized mice were harvested for evaluation of histology alteration (a-e). Abnormal cells of lung and cellular debris in the control group (b) are indicated by the black arrows. (f) Histology score in the lungs. The scale bar is 20 µm. PBS was used as a control. *p < 0.05, **p < 0.01, and ***p < 0.001.
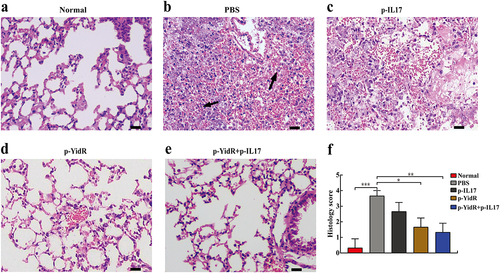
Figure S1.tif
Download TIFF Image (2.5 MB)Data availability statement
The authors confirm that the data supporting the findings of this study are available within the article and its supplementary materials.