
Figures & data
Figure 1. Distribution records for Leptopelis xenodactylus collected prior to (magenta squares) and during (black dots) this study. The areas of average relative suitability for the species (coloured polygons) were obtained from the output of the first distribution model. Inset: the mask area (red; see text) for Leptopelis xenodactylus within the KwaZulu-Natal province (grey area) of South Africa.
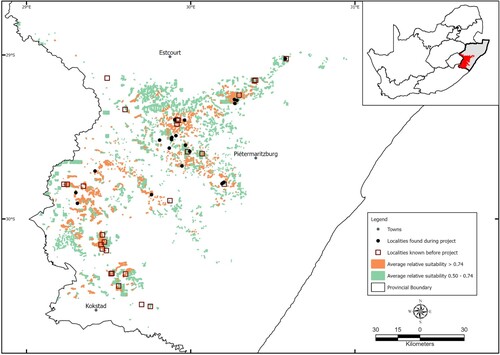
Table 1. Variables included in the distribution models according to their frequency of occurrence at locations (n = 48) with Leptopelis xenodactylus.
Figure 2. Jackknife test of variable importance using training gain (top) and using test gain (middle), and jackknife test of variable importance using area under the receiver operator characteristic curve on test data. See the text for explanation of the acronyms.
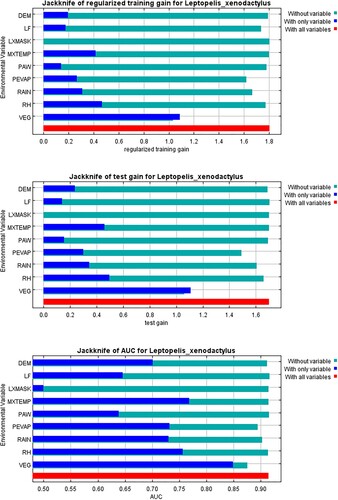
Figure 3. Average relative suitability of areas for Leptopelis xenodactylus within the predicted distribution range.
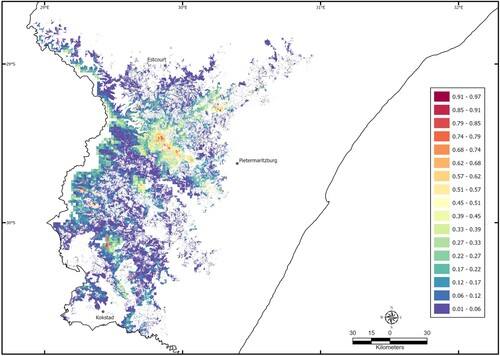
Table 2. Variables included in the MaxEnt environmental niche model for Leptopelis xenodactylus. VEG = vegetation type, RH = average summer relative humidity (%), RAIN = average summer median monthly rainfall (mm), PEVAP = mean summer monthly potential evaporation (mm), LF = landform, PAW = soil plant available water (mm), DEM = elevation (m a.s.l.), MXTEMP = average summer mean daily maximum temperatures (°C). Summer was defined as September to March. See Material and Methods for further explanation of the variables.
Table 3. Localities (n = 41) of Leptopelis xenodactylus in relation to the vulnerability framework and the two downscaled climate models (HadCM2 and GFDL2.1; Jewitt et al. Citation2015a).