1,219
Views
16
CrossRef citations to date
0
Altmetric
Research Paper

Strontium ranelate improves the interaction of osteoblastic cells with titanium substrates: Increase in cell proliferation, differentiation and matrix mineralization

, &
Article: e1027847 | Received 24 Jun 2014, Accepted 05 Mar 2015, Published online: 28 Dec 2015

Figures & data

Figure 1. Scanning electron micrographs of the pure titanium substrates. The different surface topographies were obtained by using: (A) acid etching (TAN), (B) electro-erosion processing (TE0N), (C) sandblasting (TS0N), and (D) machine-tooling (TU0N). Note the parallel grooves on the TU0N substrates. Scale bar: 25 μm.
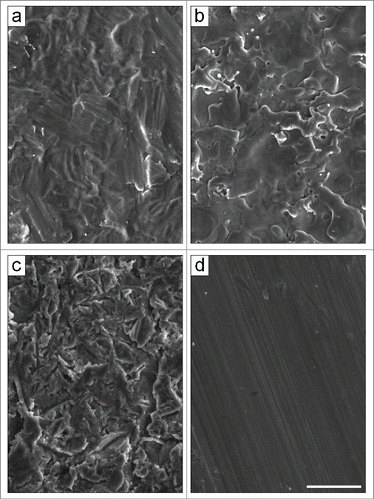
Figure 1. Scanning electron micrographs of the pure titanium substrates. The different surface topographies were obtained by using: (A) acid etching (TAN), (B) electro-erosion processing (TE0N), (C) sandblasting (TS0N), and (D) machine-tooling (TU0N). Note the parallel grooves on the TU0N substrates. Scale bar: 25 μm.

Figure 2. Fluorescence micrographs of cells labeled with FITC-phalloidin and DAPI. Cells were cultured for 24 hours. The actin cytoskeleton is shown in green and the nuclei in blue. The cells were well adhered and spread in all analyzed conditions. They often presented a stellate shape with distinct prolongations. Scale bar: 50 μm.
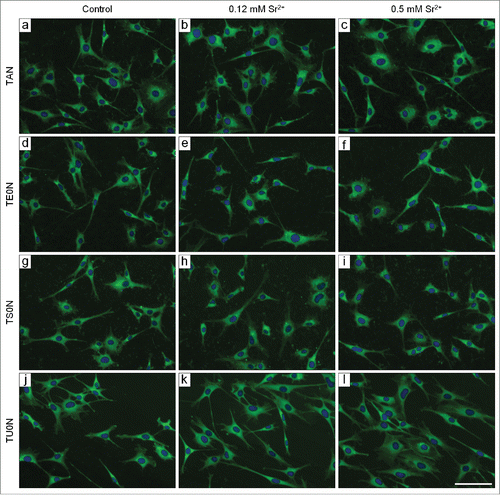
Figure 2. Fluorescence micrographs of cells labeled with FITC-phalloidin and DAPI. Cells were cultured for 24 hours. The actin cytoskeleton is shown in green and the nuclei in blue. The cells were well adhered and spread in all analyzed conditions. They often presented a stellate shape with distinct prolongations. Scale bar: 50 μm.

Figure 3. Analysis of the cell morphology. Individual cells labeled with FITC-phalloidin were analyzed with the ImageJ software after 24 hours in culture. The morphological parameters analyzed were: (A) cell area, (B) cell aspect ratio, (C) cell circularity, and (D) cell solidity. No significant differences were seen between control and treated samples in any substrate.
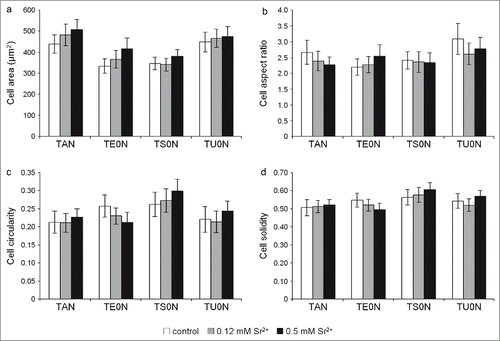
Figure 3. Analysis of the cell morphology. Individual cells labeled with FITC-phalloidin were analyzed with the ImageJ software after 24 hours in culture. The morphological parameters analyzed were: (A) cell area, (B) cell aspect ratio, (C) cell circularity, and (D) cell solidity. No significant differences were seen between control and treated samples in any substrate.

Figure 4. Analysis of cell orientation on TU0N substrates. Individual cells labeled with FITC-phalloidin were analyzed with the ImageJ software after 24 hours in culture. Alignment of the cells with the parallel grooves of TU0N substrates was quantified from 0° (perfectly aligned) to 90° (exactly perpendicular). In control and treated samples, the cells were preferentially aligned with the direction of the grooves, presenting a similar distribution.
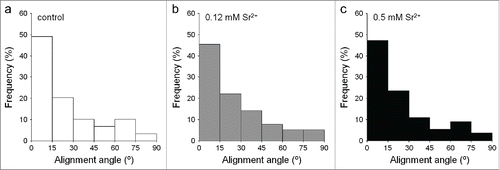
Figure 4. Analysis of cell orientation on TU0N substrates. Individual cells labeled with FITC-phalloidin were analyzed with the ImageJ software after 24 hours in culture. Alignment of the cells with the parallel grooves of TU0N substrates was quantified from 0° (perfectly aligned) to 90° (exactly perpendicular). In control and treated samples, the cells were preferentially aligned with the direction of the grooves, presenting a similar distribution.

Figure 5. Analysis of the number of cells adhered on the substrates. The nuclei labeled with DAPI were counted with the ImageJ software in images taken using a 10× objective lens. (A) After 4 hours in culture, no significant differences were found between control and treated samples in any substrate. (B) After 24 hours, the number of cells in treated samples was higher than in control in TAN and TE0N substrates, suggesting an increase in the initial cell proliferation. This increase showed a medium effect size on both substrates (r ≈ 0.3–0.5). *P < 0.05 vs. control.
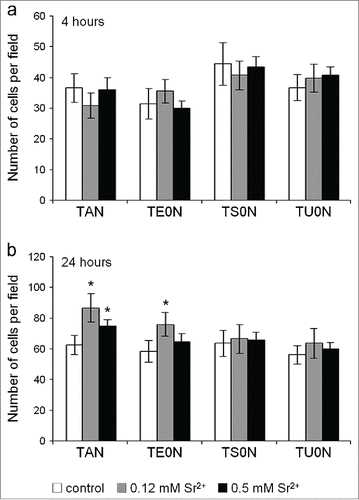
Figure 5. Analysis of the number of cells adhered on the substrates. The nuclei labeled with DAPI were counted with the ImageJ software in images taken using a 10× objective lens. (A) After 4 hours in culture, no significant differences were found between control and treated samples in any substrate. (B) After 24 hours, the number of cells in treated samples was higher than in control in TAN and TE0N substrates, suggesting an increase in the initial cell proliferation. This increase showed a medium effect size on both substrates (r ≈ 0.3–0.5). *P < 0.05 vs. control.

Figure 6. Cell proliferation assay. Live cells were monitored over time with the PrestoBlue Cell Viability Reagent. An increase in cell proliferation was seen in both treated samples in all substrates, particularly from day 7 to 21. After 7 days, this increase was quite consistent for both concentrations of the drug. In some cases, an increase in proliferation was seen only in cells treated with either 0.12 or 0.5 mM Sr2+. A large effect size was found for the increase seen on all the substrates (r > 0.5). *P < 0.05 vs. control.
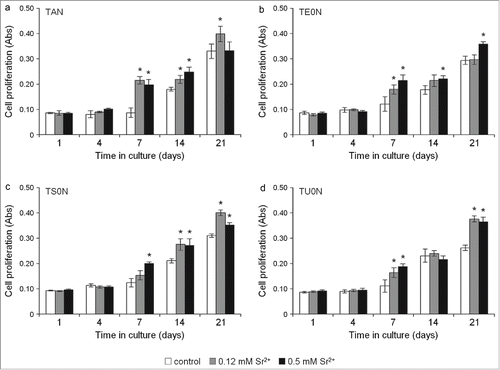
Figure 6. Cell proliferation assay. Live cells were monitored over time with the PrestoBlue Cell Viability Reagent. An increase in cell proliferation was seen in both treated samples in all substrates, particularly from day 7 to 21. After 7 days, this increase was quite consistent for both concentrations of the drug. In some cases, an increase in proliferation was seen only in cells treated with either 0.12 or 0.5 mM Sr2+. A large effect size was found for the increase seen on all the substrates (r > 0.5). *P < 0.05 vs. control.

Figure 7. Cell differentiation assay. ALP activity was analyzed in the cell culture medium by quantifying the hydrolysis of pNPP to pNP/min/μg of total protein. A clear increase in ALP activity was seen in treated samples in all substrates, especially after 21 days, indicating an increase in the differentiation of cells into mature osteoblasts. This observed increase showed a large effect size on all the substrates (r > 0.5). *P <0.05 vs. control. P < 0.05 vs. 0.12 mM Sr2+.

Figure 7. Cell differentiation assay. ALP activity was analyzed in the cell culture medium by quantifying the hydrolysis of pNPP to pNP/min/μg of total protein. A clear increase in ALP activity was seen in treated samples in all substrates, especially after 21 days, indicating an increase in the differentiation of cells into mature osteoblasts. This observed increase showed a large effect size on all the substrates (r > 0.5). *P <0.05 vs. control. †P < 0.05 vs. 0.12 mM Sr2+.
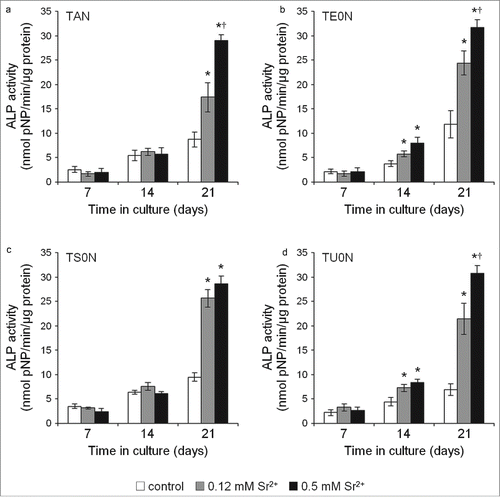
Figure 8. Fluorescence micrographs of the mineralized matrix stained with Alizarin red. Cells were cultured under mineralizing conditions for 28 days. Typical mineralized nodules were observed in all analyzed conditions. They seemed more developed in the treated samples, especially in those treated with 0.5 mM Sr2+. Scale bar: 100 μm.
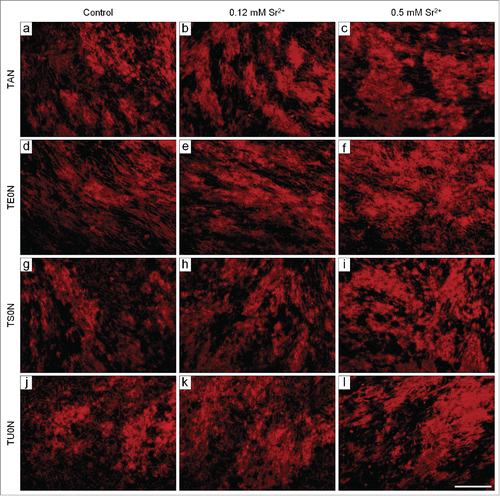
Figure 8. Fluorescence micrographs of the mineralized matrix stained with Alizarin red. Cells were cultured under mineralizing conditions for 28 days. Typical mineralized nodules were observed in all analyzed conditions. They seemed more developed in the treated samples, especially in those treated with 0.5 mM Sr2+. Scale bar: 100 μm.

Figure 9. Quantification of the mineralized matrix. (A) The extraction of Alizarin red from the stained samples showed a marked dose-dependent increase in the formation of mineralized matrix in all substrates. (B) The concentration of calcium left in the medium after culture was clearly lower in treated samples in all substrates. This is in accordance with the increase of calcium phosphate minerals deposited on the matrix. This increase in mineralization showed a large effect size on all the substrates (r > 0.5).*P < 0.05 vs. control. P < 0.05 vs. 0.12 mM Sr2+.

Figure 9. Quantification of the mineralized matrix. (A) The extraction of Alizarin red from the stained samples showed a marked dose-dependent increase in the formation of mineralized matrix in all substrates. (B) The concentration of calcium left in the medium after culture was clearly lower in treated samples in all substrates. This is in accordance with the increase of calcium phosphate minerals deposited on the matrix. This increase in mineralization showed a large effect size on all the substrates (r > 0.5).*P < 0.05 vs. control. †P < 0.05 vs. 0.12 mM Sr2+.
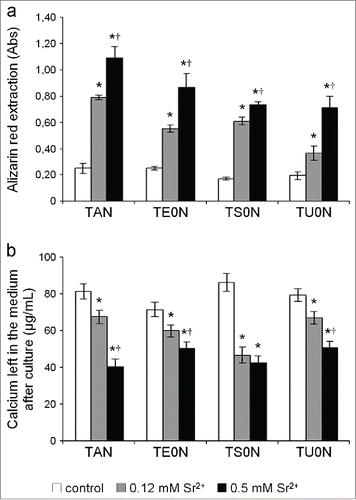
Figure 10. Typical characteristics of the bone-like matrix produced in all analyzed conditions. (A) Scanning electron micrograph. The well-developed cell layers were seen along with numerous globular accretions (see arrows in the inset) associated with an extensive mesh of randomly oriented fibrils (see asterisks in the inset). (B) FTIR spectra. Note bands of PO43− and CO32− from the carbonated apatite mineral and of Amide I and II from the organic matrix proteins. Scale bar: (a) 10 μm; (inset) 2 μm.
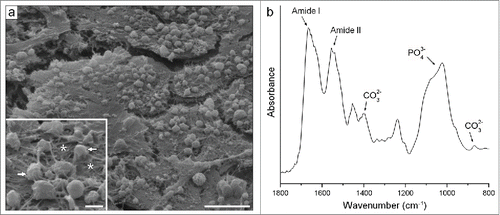
Figure 10. Typical characteristics of the bone-like matrix produced in all analyzed conditions. (A) Scanning electron micrograph. The well-developed cell layers were seen along with numerous globular accretions (see arrows in the inset) associated with an extensive mesh of randomly oriented fibrils (see asterisks in the inset). (B) FTIR spectra. Note bands of PO43− and CO32− from the carbonated apatite mineral and of Amide I and II from the organic matrix proteins. Scale bar: (a) 10 μm; (inset) 2 μm.