3,683
Views
16
CrossRef citations to date
0
Altmetric
Report

Enhanced bioactivity of glass ionomer cement by incorporating calcium silicates

, , &
Article: e1123842 | Received 16 Dec 2014, Accepted 18 Nov 2015, Published online: 22 Mar 2016

Figures & data

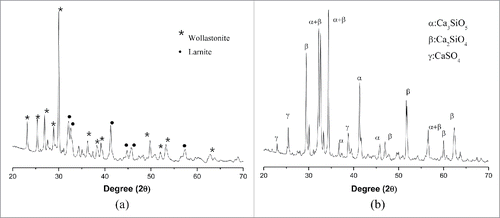
Figure 1. XRD patterns: (A) Wollastonite and (B) MTA powder.

Figure 1. XRD patterns: (A) Wollastonite and (B) MTA powder.

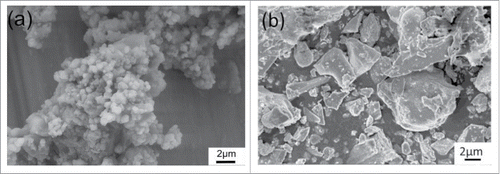
Figure 2. SEM micrographs: (A) Wollastonite and (B) MTA powder.

Figure 2. SEM micrographs: (A) Wollastonite and (B) MTA powder.

Table 1. Initial and final setting times for wollastonite modified cements.

Table 2. Initial and final setting times for MTA modified cements.

Figure 3. Compressive strength of GIC with wollastonite and MTA. Test groups with the same superscript letter are not significantly different at P < 0.05 level (one-way ANOVA, LSD's test).
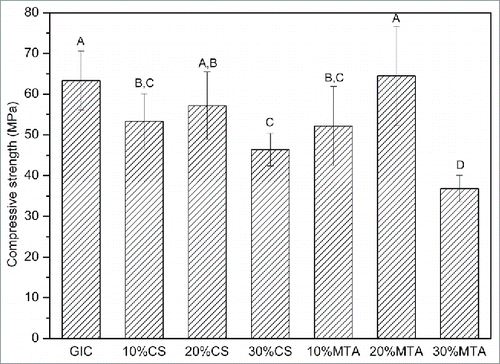
Figure 3. Compressive strength of GIC with wollastonite and MTA. Test groups with the same superscript letter are not significantly different at P < 0.05 level (one-way ANOVA, LSD's test).

Figure 4. pH changes of solution over a period of 7days. GIC with (A) Wollastonite in SBF (B) Wollastonite in water (C) MTA in SBF (D) MTA in water.
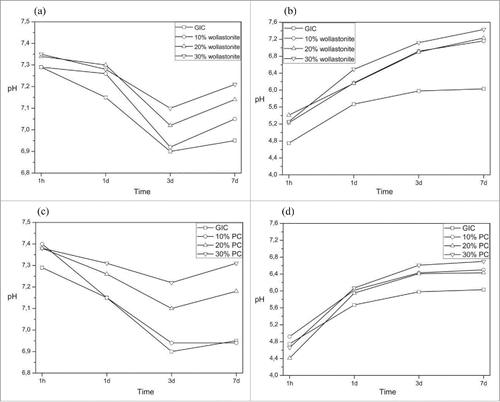
Figure 4. pH changes of solution over a period of 7days. GIC with (A) Wollastonite in SBF (B) Wollastonite in water (C) MTA in SBF (D) MTA in water.

Figure 5. SEM images of the cements with wollastonite after soaking in SBF solution. (A) GIC after 1h, (B) GIC after 7 d, (C) 10% wollastonite after 1 h (D) 10% wollastonite after 7 d, (E) 20% wollastonite after 1h, (F) 20% wollastonite after 7 d, (g) 30% wollastonite after 1h, (h) 30% wollastonite after 7 d.
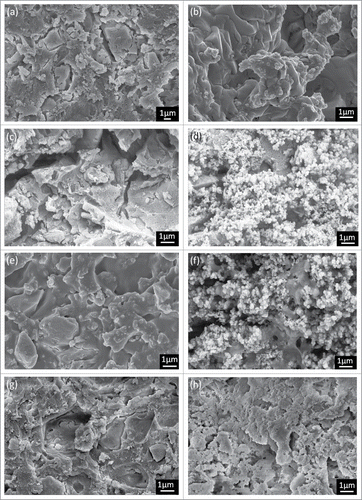
Figure 5. SEM images of the cements with wollastonite after soaking in SBF solution. (A) GIC after 1h, (B) GIC after 7 d, (C) 10% wollastonite after 1 h (D) 10% wollastonite after 7 d, (E) 20% wollastonite after 1h, (F) 20% wollastonite after 7 d, (g) 30% wollastonite after 1h, (h) 30% wollastonite after 7 d.

Figure 6. SEM images of the cements with MTA after soaking in SBF solution. (A) 10% MTA after 1 h (B) 10% MTA after 7 d, (C) 20% MTA after 1 h, (D) 20% MTA after 7 d, (E) 30% MTA after 1 h, (F) 30% MTA after 7 d.
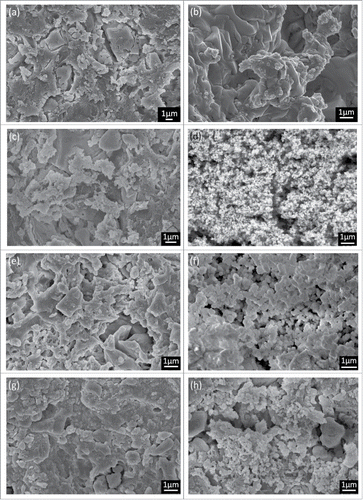
Figure 6. SEM images of the cements with MTA after soaking in SBF solution. (A) 10% MTA after 1 h (B) 10% MTA after 7 d, (C) 20% MTA after 1 h, (D) 20% MTA after 7 d, (E) 30% MTA after 1 h, (F) 30% MTA after 7 d.

Figure 7. EDX analysis: (A) GIC (B) 20% wollastonite (C) 20% MTA. The specimen was immerged in the SBF for 7 d at 37°C.

Figure 7. EDX analysis: (A) GIC (B) 20% wollastonite (C) 20% MTA. The specimen was immerged in the SBF for 7 d at 37°C.

Table 3. Initial and final setting times for wollastonite and MTA modified commercial luting cements.

Figure 8. Compressive strength of GIC modified by wollastonite and MTA, after storage in distilled water for 1 d, 7 d and 14 d. Test groups with the same superscript letter are not significantly different at P < 0 .05 level (one-way ANOVA, LSD's test).
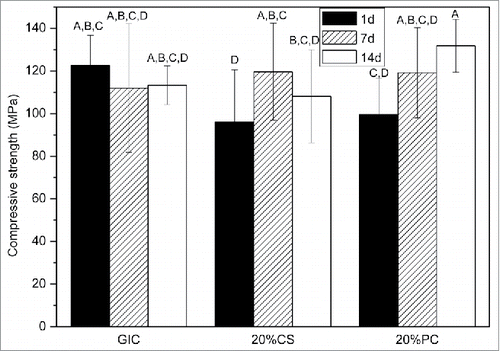
Figure 8. Compressive strength of GIC modified by wollastonite and MTA, after storage in distilled water for 1 d, 7 d and 14 d. Test groups with the same superscript letter are not significantly different at P < 0 .05 level (one-way ANOVA, LSD's test).

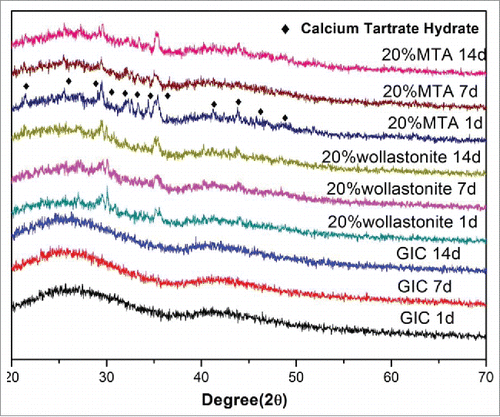
Figure 9. XRD spectra of the cements after hardening for 1 d, 7 d and 14 d in SBF.

Figure 9. XRD spectra of the cements after hardening for 1 d, 7 d and 14 d in SBF.

Figure 10. SEM images of the cements after soaking in SBF solution. (A) GIC after 1 h, (B) GIC after 14 d, (C) 20% wollastonite after 1 h (D) 20% wollastonite after 14 d, (E) 20% MTA after 1 h, (F) 20% MTA after 14 d.
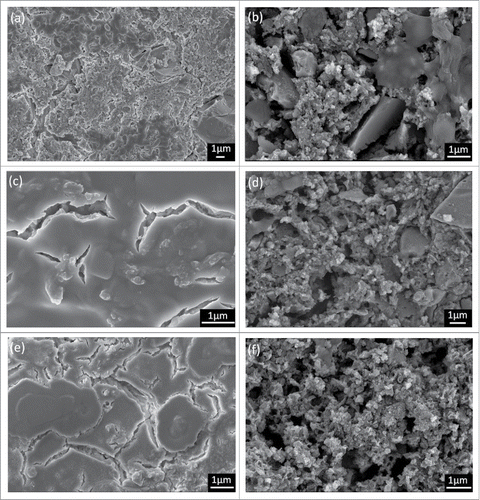
Figure 10. SEM images of the cements after soaking in SBF solution. (A) GIC after 1 h, (B) GIC after 14 d, (C) 20% wollastonite after 1 h (D) 20% wollastonite after 14 d, (E) 20% MTA after 1 h, (F) 20% MTA after 14 d.

Figure 11. EDX of commercial GIC modified by wollastonite and MTA: (A) GIC (B) 20% wollastonite (C) 20% MTA. The specimen was immerged in the SBF for 14 d at 37°C.

Figure 11. EDX of commercial GIC modified by wollastonite and MTA: (A) GIC (B) 20% wollastonite (C) 20% MTA. The specimen was immerged in the SBF for 14 d at 37°C.

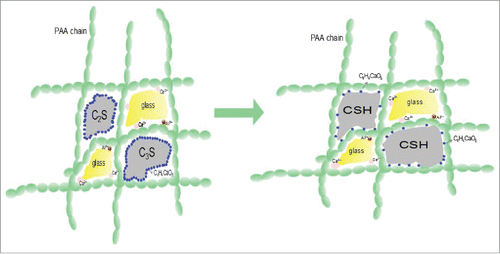
Figure 12. Possible mechanism for the reaction of glass ionomer cement, MTA and tartaric acid.

Figure 12. Possible mechanism for the reaction of glass ionomer cement, MTA and tartaric acid.