Figures & data
Figure 1. PLA aminolysis reaction involving (A) polyallylamine (PAAm) and (B) ethylenediamine (EtDA).
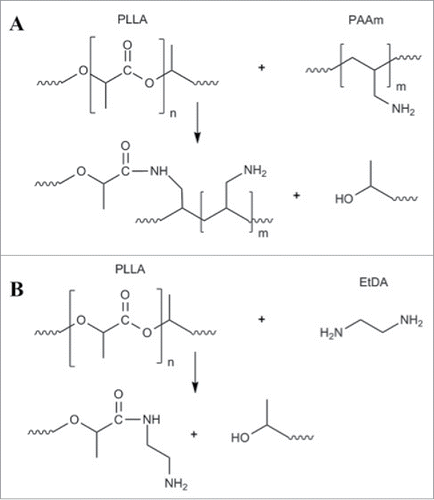
Figure 2. SEM imaging of (A) pristine and (B-D) PAAm-treated PLA nanofibers. PAAm grafting was carried out at pH 12.5 and 60°C for (B) 1 h, (C) 3 h, and (D) 20 h.
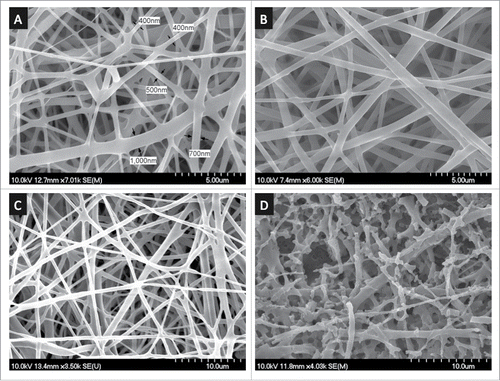
Table 1. Properties of pristine and aminolysed PLA nanofibers.
Figure 3. Characterization of the EGF grafting on PLA nanofibers by direct ELISA (n = 4). Optical densities (O.D.) corresponding to PAAm-covered mats treated with (A) PEG linker, EGF and ethanolamine (for deactivation of unreacted PEG), (B) Mats covered with PEG linkers that were deactivated before EGF incubation (C) or without any EGF incubation (D) were used as negative controls. As reference, the O.D. value obtained on (D) unmodified PAAm-covered mats is presented. Statistical differences are noted * (p < 0.05).
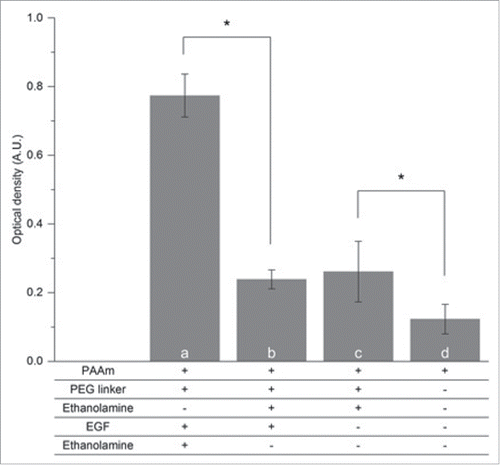
Figure 4. NSLC proliferation on pristine, PAAm-grafted, EGF-grafted and laminin-coated PLA mats (n = 3). Cells were cultured in basal medium (denoted “-”) or basal medium supplemented with FGF only (denoted FGF) or a mix of FGF and EGF (denoted F + EGF) for 2 d (D2, light gray), 6 d (D6, medium gray) or 10 d (D10, dark gray). Error bars correspond to standard deviation. Statistical differences noted * correspond to p < 0.05.
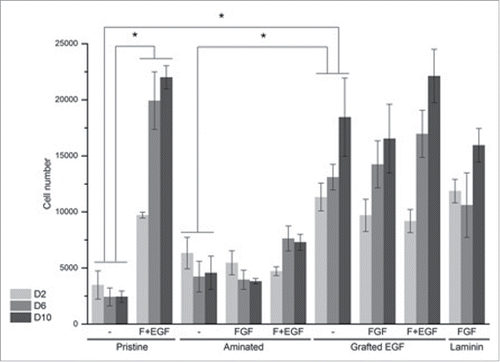
Figure 5. Representative fluorescence imaging (SYTOX) for NSLCs cell proliferation after 10 d of culture on pristine (A, B), PAAm-grafted (C, D), EGF-grafted (E, F, G) and laminin-coated PLA mats (H). Cells were cultured in basal medium (denoted “-”) or basal medium supplemented with FGF only (denoted FGF) or a mix of FGF and EGF (FGF/EGF). Scale bars correspond to 400 µm.
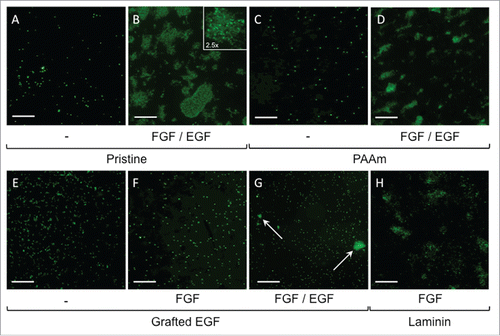
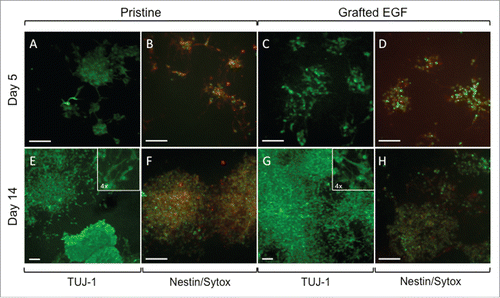
Figure 6. Representative Fluorescent imaging of NSLCs cultured after 5 d (A-D) or 14 d (E-H) of culture on pristine and EGF-grafted mats. Cells were positively stained for ßIII-Tubulin (A, E, C, G) and nestin (B, F, D, H) under continued proliferation conditions. Cell nuclei were labeled with SYTOX green (B, F, D, H). The scale bars correspond to 100 μm. When present, insets correspond to a 4x higher magnification of the corresponding image.