
Figures & data
Figure 1. Leptin was highly expressed and the JAK2/STAT3 pathway was activated in endometrial cancer patients. (a) ELISA was used to assess the expression levels of leptin in normal and tumour tissues. (b, c) Western blotting and IHC staining showed the expression levels of JAK2/STAT3 in normal and tumour tissues. N: normal endometrial tissue; T: endometrial cancer tissue. *p < 0.05, ** p < 0.01, *** p < 0.001.
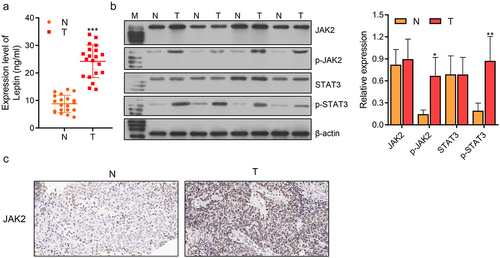
Figure 2. Adipocytes increased the levels of leptin, cell migration and invasion, cell activity and proliferation, and promoted the EMT process. (a) ELISA assays were performed to examine the levels of leptin in the Blank and co-cultured systems. (b) Transwell assays were performed to examine cell migration and invasion in the Blank and co-culture systems. (c) Western blotting was used to assess the expression levels of EMT biomarkers (E-cad, N-cad, and Vimentin) in the Blank and co-culture systems. (d) CCK-8 assays were performed to evaluate the activity levels of Ishikawa and MFE-280 cells in the Blank and co-culture systems groups at time points of 0 h, 24 h, 48 h, and 72 h. (e) EdU staining was used to evaluate cell proliferation in the Blank and co-culture systems. *p < 0.05, **p < 0.01, ***p < 0.001.
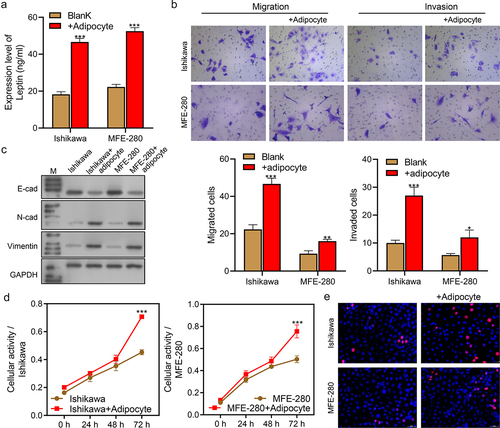
Figure 3. Leptin increased cell migration and invasion, cell activity and proliferation, and promoted the EMT process. (a) ELISA assays were performed to evaluate the levels of leptin in transfected cells. (b) Transwell assays were performed to assess the migration and invasion abilities of transfected cells. (c, d) Western blotting was used to assess the expression levels of EMT biomarkers (E-cad, N-cad, and Vimentin) and JAK2/STAT3 signaling pathway proteins in transfected cells. (e) CCK-8 assays were performed to evaluate the activity of transfected Ishikawa and MFE-280 cells at time points of 0 h, 24 h, 48 h, and 72 h. (f) EdU staining was used to assess the proliferation of transfected cells. *p < 0.05, **p < 0.01, ***p < 0.001 vs. +Adipocytes.
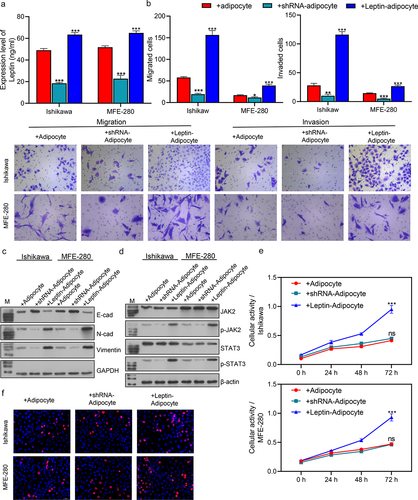
Figure 4. Leptin increased cell migration and invasion, cell activity and proliferation, and promoted the EMT process. (a) CCK-8 assays were performed to evaluate the activity of leptin-treated Ishikawa and MFE-280 cells at time points of 0 h, 24 h, 48 h, and 72 h. (b) EdU staining was used to assess the proliferation of Ishikawa and MFE-280 cells treated with graded concentrations of leptin. (c) Transwell assays were performed to evaluate the migration and invasion abilities of Ishikawa and MFE-280 cell treated with graded concentrations of leptin. (d, e) Western blotting was used to assess the expression levels of EMT biomarkers (E-cad, N-cad, and Vimentin) and JAK2/STAT3 signaling pathway-related proteins in Ishikawa and MFE-280 cells treated with graded concentrations of leptin. (f) If analyses were performed to evaluate the expression levels of p-JAK2 and p-STAT3 in Ishikawa and MFE-280 cells treated with graded concentrations of leptin. *p < 0.05, **p < 0.01, ***p < 0.001 vs. Blank.
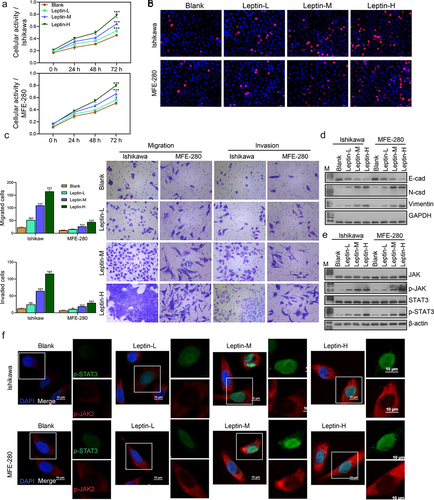
Figure 5. Leptin increased cell progression and promoted EMT via the JAK2/STAT3 signalling pathway. (a) CCK-8 assays were performed to evaluate the activity of Ishikawa and MFE-280 cells treated with Blank, leptin, leptin+AG490, and leptin+JSI-124 at time points of 0 h, 24 h, 48 h, and 72 h. (b) EdU staining was used evaluate the proliferation of Ishikawa and MFE-280 treated with Blank, leptin, leptin+AG490, and leptin+JSI-124. (c) Transwell assays were performed to examine the migration and invasion abilities of Ishikawa and MFE-280 cells treated with Blank, leptin, leptin+AG490, and leptin+JSI-124. (d, e) Western blotting was used to assess the expression levels of EMT biomarkers (E-cad, N-cad, and Vimentin) and JAK2/STAT3 signaling pathway proteins in Ishikawa and MFE-280 cells treated with Blank, leptin, leptin+AG490, and leptin+JSI-124. (f) If analyses were performed to evaluate the expression levels of p-JAK2 and p-STAT3 in Ishikawa and MFE-280 treated with Blank, leptin, leptin+AG490, and leptin+JSI-124. ***p < 0.001 vs. Blank, ###p < 0.001 vs. leptin.
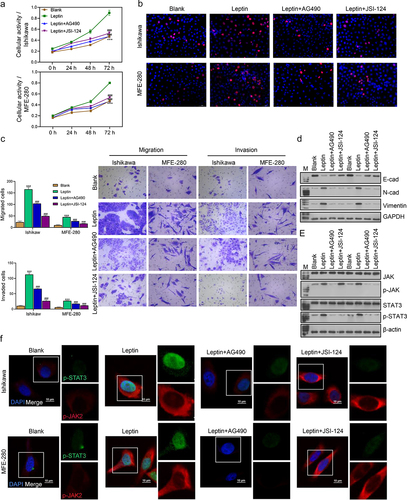
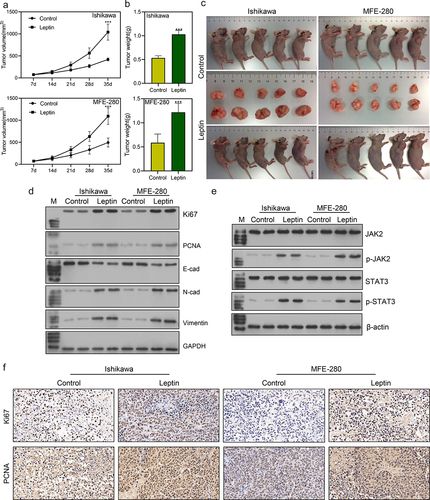
Figure 6. Leptin promoted endometrial cancer tumour growth in vivo. (a-c) The volumes and weights of tumours were measured in the control and leptin injection groups. (d, e) Western blot studies were performed to assess the expression levels of Ki67, PCNA, EMT biomarkers, and JAK2/STAT3. (f) IHC staining was used to evaluate the expression levels of Ki67 and PCNA. ***p < 0.001 vs. control.
Data availability statement
All data are available from the figshare with request. (doi: 10.6084/m9.figshare.23742015)