
Figures & data
Figure 1. Overview of study flow chart.
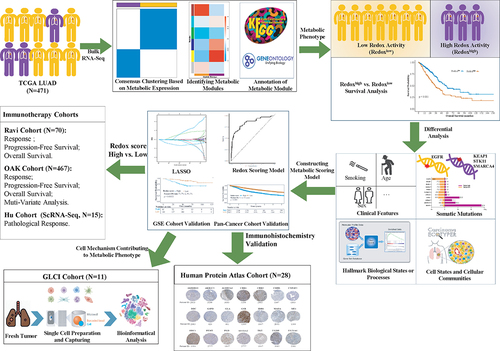
Figure 2. Identification of metabolic phenotypes in lung adenocarcinoma. (a) Two metabolic phenotypes of LUAD (Cluster a and (b) identified by unsupervised consensus clustering. (b) Kaplan–Meier analysis reveal poor prognosis in Cluster B. (c) a dendrogram of clustered genes in WGCNA, with each color representing a co-expressed gene module and each branch representing a gene. (d) Correlation heatmap showing the relationship between metabolic phenotypes and metabolic gene modules. Numbers indicate the correlation coefficient, followed by a statistical p-value in parentheses. (e) Differential expression analysis of three gene modules (MEbrown, MEyellow, and MEblue) between two metabolic phenotypes. (f) Cluster B identified as LUAD with high reductase-oxidative activity (redoxhigh LUAD). (g) Output of superoxide anion (O2-) and pathway score of ROS detoxification analyzed by metabolic flux balance. LUAD, lung adenocarcinoma.
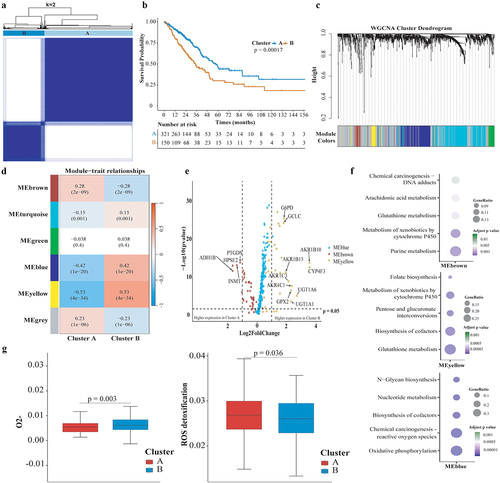
Figure 3. Comparison of Molecular features and Enrichment Scores of Hallmark Gene Sets between Metabolic Phenotypes. (a) Volcano plots comparing somatic mutations across metabolic phenotypes, with the horizontal axis representing the odds ratio and the vertical axis representing the statistical significance; (b) Bar plot shows mutation frequencies of representative genes in redoxhigh and redoxlow LUAD; (c) Horizontal axis representing pathway signatures and the vertical axis representing statistical significance. Dots above the horizontal axis indicate pathways upregulated in redoxhigh LUAD, below indicate pathways upregulated in redoxlow LUAD.
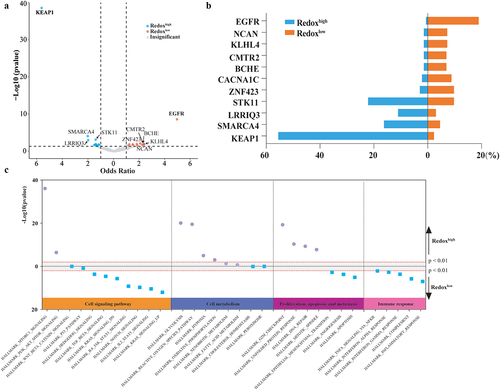
Figure 4. Comparative analysis of cell communities and states across metabolic Phenotypes. (a) Distribution of cell states and carcinoma ecotypes (CEs) within the TCGA LUAD cohort. The horizontal axis denotes tumor samples, while the vertical axis categorizes cell states (S01-S09) and their respective cell types (e.g., CD8+T cells) found in each tumor sample. The heatmap illustrates the proportion of each cell state within its corresponding cell type. CEs were identified by clustering the predominant cell state of each cell type within individual samples. Details on cell state annotation and marker genes are provided in Supplemental Table S3. (b) CE comparison across metabolic phenotypes. (c) Comparison of predominant cell states by cell type across metabolic phenotypes.
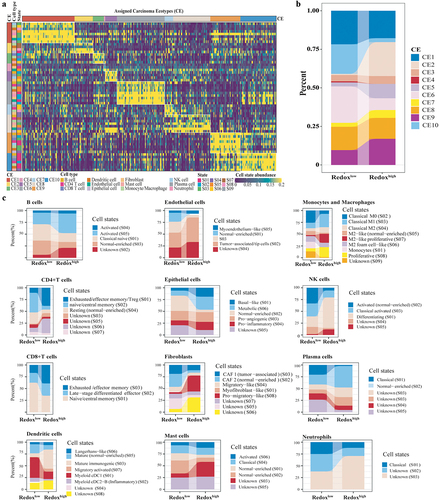
Figure 5. Construction and validation of redox scoring model in LUAD. (a) Tenfold cross-validation of the LASSO Cox regression model for tuning parameter selection, with the horizontal axis representing log(lambda) and the vertical axis representing misclassification error. (b) ROC curve analysis of redox scoring model for predicting metabolic phenotypes in the validation cohort. (c) the immunohistochemistry-based expression of genes from the redox scoring model in LUAD tumor tissues, utilizing data sourced from the Human Protein Atlas, not conducted in-house. (d) Kaplan–Meier analysis of OS between high and low redox score groups in the GSE31210 LUAD cohort. (e) Kaplan–Meier analysis of OS between high and low redox score groups in the TCGA pan-cancer cohort.
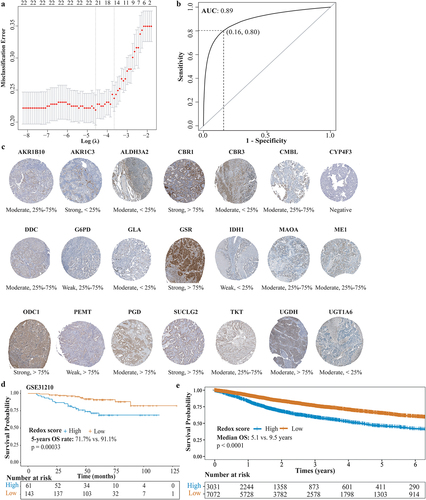
Figure 6. ScRNA-seq analysis on the metabolic phenotype shaping mechanism. (a) UMAP plot of the 44,352 cells, visualizing the distribution and clustering of cell types. (b) Dot plot showcasing the expression of marker genes across all identified cell types. (c) Expression of twenty-two genes of redox scoring model in each cell type at the single-cell level. (d) Redox signature in each cell type. (e) Re-clustering of epithelial cells. (f) Results of identifying malignant cells by Infer-CNV analysis. (g) Comparison of redox signature between malignant cells and normal cells or between EGFR wild-type epithelial cells and EGFR-mutant epithelial cells. (h) the correlation between mTORC1 signaling and redox signature.
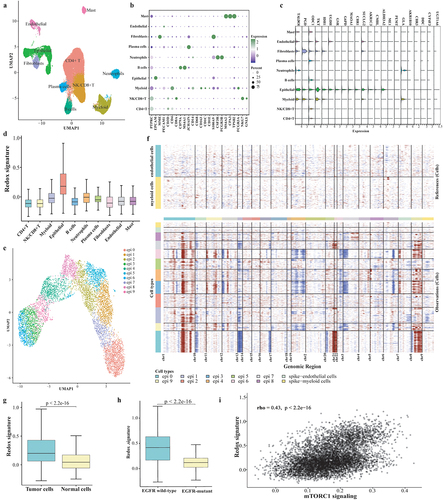
Figure 7. The association between redox signature and CD8+T cells. (a) Re-clustering of CD8+T cells. (b) Normalized Z-score expression of marker genes in subtypes of CD8+T cells. (c) Proportions of subtypes of CD8+T cells in individual samples (up) and across redoxhigh and redoxlow (bottom). (d) Correlation between redox signature and abundance of CD8+T cells. (e) Analysis of CD8+Trm signature, expression of specific Trm markers (CD69 and CD103) using tissue RNA microarray of GSE31210GSE cohort without EGFR mutation. (f) Predicted modulation of tumor cells to CD8+T cells by NicheNet. Relative expression of predicted ligands in tumor cells of redoxhigh vs. redoxlow (the left panel) and heatmap showing the interaction potential of top-ranked ligands in tumor cells with corresponding receptors in CD8+T cells (the right panel). (g) Expression of cytotoxic chemokines, MKI67, and CXCL13 in CD8+T cells at pre-treatment and post-treatment of neoadjuvant chemoimmunotherapy. (h) Expression of cytotoxic chemokines, MKI67, and CXCL13 in CD8+T cells between MPR and NMPR after neoadjuvant chemoimmunotherapy. (i) Abundance of CD8+T cells at pre-treatment and post-treatment of neoadjuvant chemoimmunotherapy in Hu cohort. (j) Abundance of CD8+T cells in major pathological response (MPR) and non-major pathological response (NMPR) after neoadjuvant chemoimmunotherapy (post-treatment) in Hu cohort. Trm, tissue-resident memory T cell; Tcyt, cytotoxic T cell; Tem, effector memory T cell; Tcm, central memory T cell.
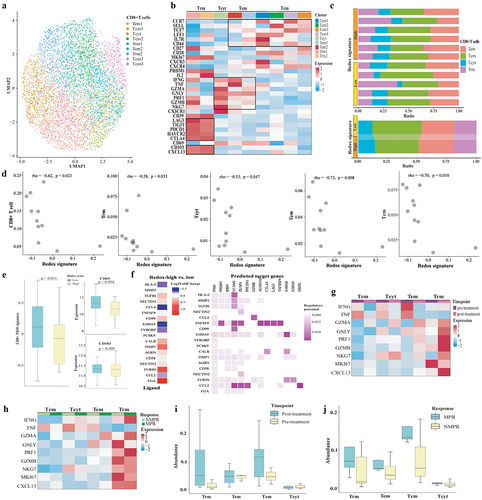
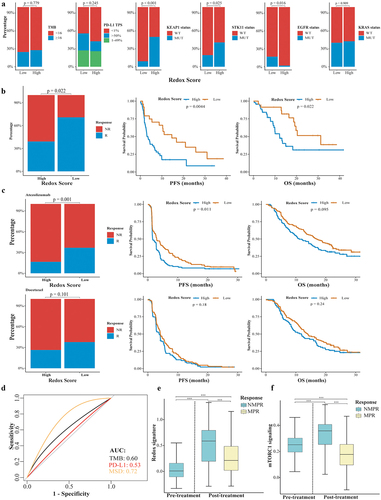
Figure 8. Impact of metabolic phenotypes on response to ICIs in lung adenocarcinoma. (a) Distribution of tTMB, PD-L1 expression, KEAP1/STK11/EGFR/KRAS status in high and low redox score groups. (b) Comparison of response rate, PFS, and OS between high and low redox score groups in patients receiving immunotherapy in Ravi cohort. (c) Comparison of response rate, PFS, and OS between high and low redox score groups in OAK cohort patients receiving atezolizumab (upper) or docetaxel (lower). (d) ROC curve analysis comparing redox score (low vs. high), PD-L1 TPS (<1% vs. >1%), and tTMB (<16 vs. ≥16) in predicting responders to atezolizumab. (e) Changes of redox signature between pre-treatment and post-treatment or between patients achieved NMPR and MPR in neoadjuvant immunochemotherapy cohort. (f) Changes of mTORC1 signaling between pre-treatment and post-treatment or between patients achieved NMPR and MPR in neoadjuvant immunochemotherapy cohort. tTMB, tissue tumor mutation burden; PFS, progression-free survival; OS, overall survival; NMPR, non-major pathological response; MPR, major pathological response.
Supplemental Table.xlsx
Download MS Excel (88.3 KB)Supplemental Fig 3.tif
Download TIFF Image (2.9 MB)Supplemental Fig 1.tif
Download TIFF Image (1.7 MB)Supplemental Fig 4.tif
Download TIFF Image (3.6 MB)Supplemental Fig 5.tif
Download TIFF Image (1 MB)Supplementary Material.docx
Download MS Word (17.9 KB)Supplemental Fig 2.tif
Download TIFF Image (660.1 KB)Data availability statement
TCGA datasets were available in https://portal.gdc.cancer.gov/. GEO dataset was available at the following URL: https://www.ncbi.nlm.nih.gov/geo/query/acc.cgi?acc= GSE31210. Single cell sequencing data of GLCI cohort and Hu cohort was available at the following URL: https://www.ncbi.nlm.nih.gov/geo/query/acc.cgi?acc= GSE171145 and https://www.ncbi.nlm.nih.gov/geo/query/acc.cgi?acc=GSE207422. Bulk RNA-seq and clinical data of OAK cohort was available upon request at the following URL: https://ega-archive.org/studies/EGAS00001005013. Bulk RNA-seq and clinical data of Ravi cohort was available at the following URL: https://www.nature.com/articles/s41588-023-01355-5. Request for other resources should be directed to the corresponding author.