
Figures & data
Figure 1. The expression of CMC1 associates with T cell activation and apoptosis.
(a) CD8+T cells were cultured in different cytokines and analyzed by western blotting.
(b) Day 6 CD8+Teff cells restimulated by α-CD3, α-CD28 at indicated time-points in the presence of IL-2 and analyzed by western blotting.
(c) RNA-seq DEGs of CD8+Teff cells restimulated as in (B) were analyzed using STEM software. Each box represents a specific cluster of genes that share the same gene expression dynamic pattern at 0, 3, 5, 12 hours. Boxes with colors have p values < 0.05.
(d,e) Gene ontology and KEGG pathway enrichment analysis of the first four gene clusters (pink) of (C) via Metascape online platform.Citation19
(f) Heatmap showing representative genes in the first four gene clusters (pink) of C.
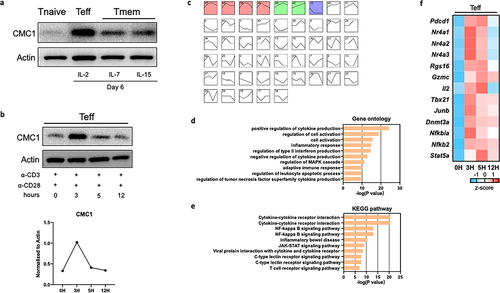
Figure 2. CMC1 accelerates CD8+Teff cells activation and apoptosis.
(a-j) Representative FCM contour dot plot and quantitative graphs of Day 6 in vitro-induced CD8+Teff cells from WT and Cmc1-/- mice. The analyzed markers includes CD25, GZMB, Perforin, TNFα, IFNγ, T-bet.
(k and l) Representative FCM plots of CD8+Teff cells restimulated as in () were stained for Annexin V (AV) and PI. Scatter plot shows the frequency of AV−PI− cells.
(m) RT-qPCR quantification of Hk2, Glut1, Ldha, and Pkm mRNA expression of CD8+Teff cells as in (a-n).
(n) Lactate concentration assay performed on the culture medium obtained from CD8+Teff cells as in (A-J).
(o and p) Representative FCM histograms and quantitative bar graph of Day 6 in vitro-induced CD8+Teff cells from WT and Cmc1-/- mice were stained for 2NBDG.
Dots in all plots represent individual sample data. N = 3 mice for each group. Data are presented as means ± SEM. Statistical analysis was by Student’s t test (b, d, f, h, j, n, p) or Two way ANOVA and Sidak’s multiple comparisons test (l and m).
*p < 0.05, **p < 0.01, ***p < 0.001, ****p < 0.0001. MFI, mean fluorescence intensity.
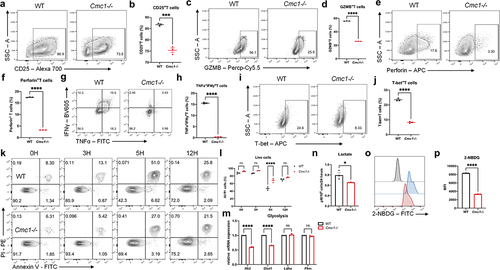
Figure 3. Cmc1-/- CD8+T cells retain more CD44+CD62L+Tm cells and survive longer upon secondary activation in vitro.
(a) Representative FCM dot plots of spleen and lymph node (LN) cells from WT or Cmc1-/-mice stained for CD44 and CD62L (Gated on CD8+T cells).
(b) Quantification of the percentage of CD44−CD62L+ (Tnaive), CD44+CD62L+ (Tmem), CD44+CD62L− (Teff) populations of (A).
(c) Representative FCM dot plots of in vitro induced CD8+Tmem cells (IL-7) from WT or Cmc1-/- mice restimulated by anti-CD3/CD28 antibodies for 24 hours and stained for CD44 and CD62L.
(d) Quantification of the percentage of CD44+CD62L+ (Tmem), CD44+CD62L− (Teff) populations of (c).
(e) Representative FCM dot plots of in vitro induced CD8+Tmem cells (IL-7) from WT or Cmc1-/- mice restimulated by anti-CD3/CD28 antibodies for 24 hours and stained for CCR7.
(f) Quantification of the percentage of CD44+CD62L+CCR7+ (Tcm) population of (e).
(g) Quantification of live cell counts after the reactivation in (c and e) using Trypan Blue staining.
Dots in all plots represent individual sample data. Data are presented as means ± SEM. Statistical analysis was by Student’s t test (g) or Two way ANOVA and Sidak’s multiple comparisons test (b, d, f). *p < 0.05, **p < 0.01, ***p < 0.001, ****p < 0.0001. MFI, mean fluorescence intensity.
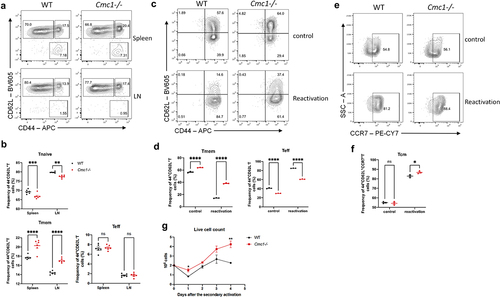
Figure 4. CMC1 deficiency attenuates CD8+T cells exhaustion-like development during chronic TCR stimulation.
(a) CD8+T cells were stimulated by α-CD3 and α-CD28 for different periods (A: acute or C: chronic) in the presence of IL-2 and analyzed by western blotting.
(b) Representative FCM plots of acute or chronic stimulated CD8+T cells were stained for PD-1 and Tim-3.
(c) Quantification of the percentage of PD-1+Tim-3+ population (Tex) of (b).
(d–e) Quantification of PD-1, Tim-3 MFI of (c).
(f–i) Representative FCM Histograms and MFI quantification of acute or chronic stimulated CD8+T cells were stained for TOX and TCF1.
(j) Representative FCM plots of chronically stimulated CD8+T cells from WT or Cmc1-/- mice were stained for PD-1 and Tim-3.
(k–m) Quantification of the percentage of PD-1+Tim-3+ population (Tex), PD-1, Tim-3 MFI of (J).
(n) Representative FCM plots of chronically stimulated CD8+T cells from WT or Cmc1-/- mice were stained for TCF1 and PD-1.
(o–q) Quantification of the percentage of TCF1hiPD-1hi population (progenitor Tex), TCF1, TOX MFI of ().
(r) CD8+T cells from WT or Cmc1-/- mice were stimulated by α-CD3, α-CD28 for different periods (Acute or Chronic) in the presence of IL-2 with or without L-lactate (10 μm) and analyzed by western blotting.
Dots in all plots represent individual sample data. N = 3 for each group (a, b, f, h, j, n, r). Data are presented as means ± SEM. Statistical analysis was by Student’s t test.
*p < 0.05, **p < 0.01, ***p < 0.001, ****p < 0.0001. MFI, mean fluorescence intensity.
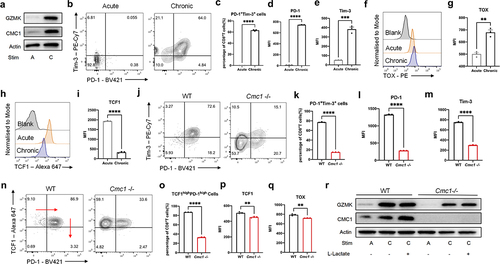
Figure 5. Lactate enhances CMC1 expression through USP7-mediated stabilization and de-ubiquitination of CMC1 protein.
(a) Volcano plot shows the Pan Kla differentially modified gene promotors of CD8+Teff cells treated with or without L-Lactate (10 μm).
(b-c) CD8+Teff cells were treated with or without L-Lactate (10 μm) for 24 hours, or in the presence of A485 and were analyzed by western blotting.
(d) CD8+Teff cells were treated with CHX (50ug/ml) for indicated hours and were analyzed by western blotting.
(e) CD8+Teff cells were treated with MG132 (50 μm) for indicated hours or L-Lactate (10 μm) for 24 hours and were analyzed by western blotting.
(f and g) Whole-cell lysates from CD8+Teff cells were subjected to immunoprecipitation with a control IgG or an anti-CMC1 or an anti-USP7 antibody by western blotting.
(h) 293T cells were co-transfected with the indicated plasmids and treated by MG132 (20 μm) for 4 hours before being harvested and followed by western blotting with anti-HA antibody.
(i) CD8+Teff cells treated with P5091 for indicated concentrations in the presence of L-Lactate (10 μm) for 24 hours were analyzed by western blotting.
(j) Schematic process of the proposed mechanism of lactate promotes CMC1 expression through USP7.
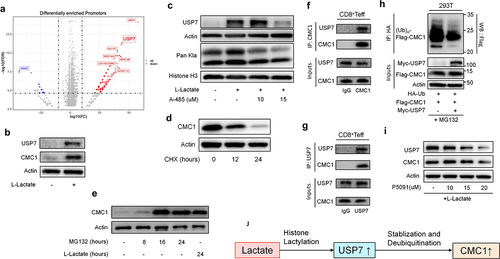
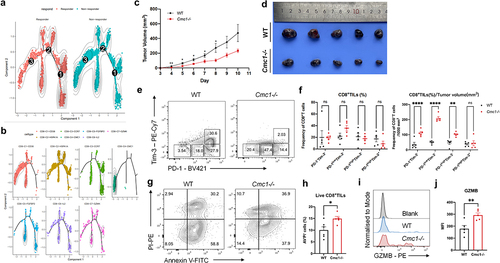
Figure 6. Tumor-bearing Cmc1-/- mice have more non-exhausted and progenitor exhausted CD8+TILs.
(a and b) Trajectory analysis for the 7 CD8+T cells clusters found in (a). Cell expression profiles in a two-dimensional independent space. A solid black line indicates the main diameter path of the minimum spanning tree (MST) and provides the backbone of Monocle’s pseudotime ordering of the cells. Each dot represents an individual cell colored by pseudotime (above) or by cluster (below).
(c-j) WT and Cmc1−/−mice were subcutaneously inoculated 5 × 10⁵ B16-OVA cells/mouse. n = 5 mice for each group. The FCM was performed on Day 10 when the tumors were harvested.
(c) Tumor growth curves after the inoculation of B16-OVA cells.
(d) Photograph showing melanoma harvested from the indicated WT and Cmc1-/-mice.
(e) Representative FCM plots of CD8+TILs from WT or Cmc1-/- mice were stained for PD-1 and Tim-3.
(f) Frequency of the gated cell populations in (e), and the ratios of the cell populations of (e) to tumor volume in (c and d) on Day 10.
(g) Representative FCM plots of CD8+TILs from WT or Cmc1-/-mice were stained for AV and PI.
(h) Quantification of the percentage of AV−PI− (live cells) population of (g).
(i) Representative FCM plots of CD8+TILs from WT or Cmc1-/-mice were stained for GZMB.
(j) MFI quantification of GZMB in (i).
Dots in all plots represent individual sample data. Data are presented as means ± SEM. Statistical analysis was by Student’s t test (c, h, j) or Two way ANOVA and Sidak’s multiple comparisons test (f). *p < 0.05, **p < 0.01, ***p < 0.001, ****p < 0.0001. MFI, mean fluorescence intensity.
Supplemental material